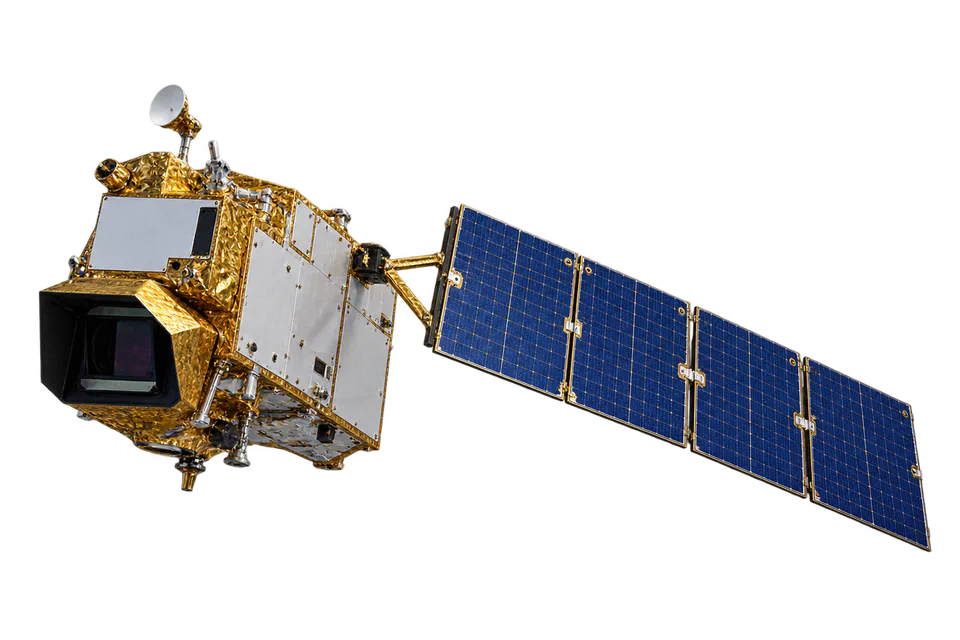
NIGHTTIME LIGHTS
Map human activity
Explore the geography of nighttime lights and discover how economic activity is distributed across places.
Explore the mapOn the geography of development
Our mission is to promote interdisciplinary science for economic, social, and environmental sustainability. We integrate insights from development economics, spatial data science, and applied econometrics to understand and inform the process of sustainable development.
 Earth at night VIIRS / 2016 · QuaRCS network
Earth at night · Asia
Earth at night VIIRS / 2016 · QuaRCS network
Earth at night · AsiaDrag horizontally or use the arrow keys to rotate. Use the buttons to pause, change region, or zoom.
01 / THE RESEARCH QUESTIONS
Satellite observations reveal patterns. Spatial econometrics, causal inference, and machine learning help us investigate the forces behind them.
The QuaRCS Network is an international and interdisciplinary research network in Quantitative Regional and Computational Science. We integrate insights from economics and spatial data science to understand and inform the process of sustainable development across subnational regions and countries. Our focus spans the economic, social, and environmental dimensions of sustainable development.
NIGHTTIME LIGHTS
Explore the geography of nighttime lights and discover how economic activity is distributed across places.
Explore the mapCHANGE OVER TIME
Compare luminosity across regions and over time. Start with a pattern, then ask what might explain it.
Explore the trendsPOPULATION & PLACE
Explore population patterns alongside the geography of light to frame new questions about people and development.
Explore population
02 / BEHIND THE RESEARCH
I’m Carlos Mendez, Associate Professor of Development Economics at Nagoya University, Japan. My research aims to integrate development economics, spatial data science, and applied econometrics to understand and inform the process of sustainable development.
QUARCS LAB / NAGOYA
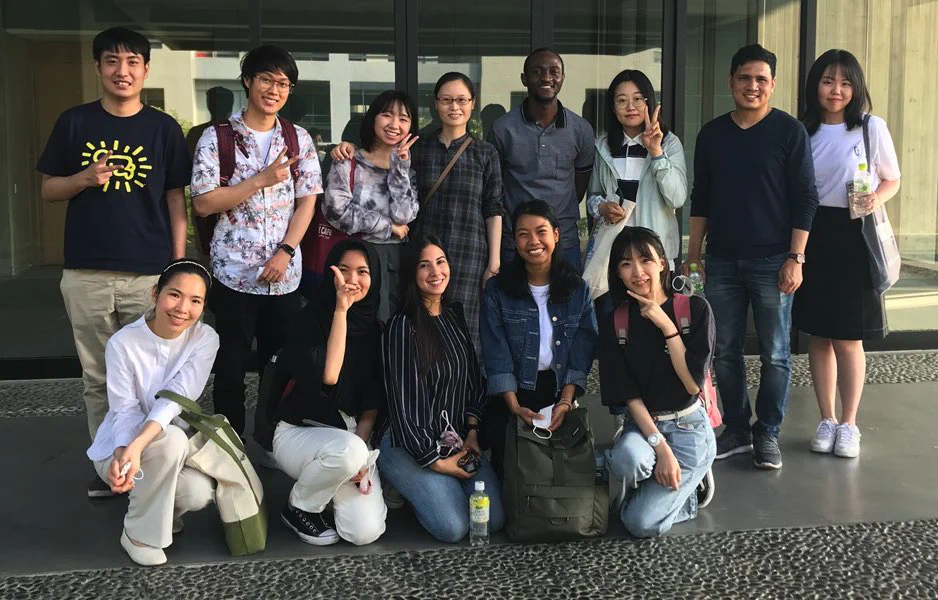
Our lab brings researchers and students together to study regional development through economics, spatial data, and computational methods.
 Abdulah Rusli (Indonesia)PhD student 2023-2027
 Bimo Arvianto (Indonesia)PhD student 2025-2028
 Cesar Echevarria (Peru)PhD student 2024-2027
 Favio Leiva CárdenasPhD student 2023-2027
 He Du (China)PhD Student, 2025 to 2028
 Laura Constanza Prieto Granados (Colombia)PhD student 2026-2029
 Li Xiaomeng (China)PhD student 2025-2028
 Mujkanovic Adin (Bosnia and Herzegovina)Master student 2025-2027
 Phon Sophat (Cambodia)PhD student 2024-2027
 Sour Heng (Cambodia)PhD student 2023-2026
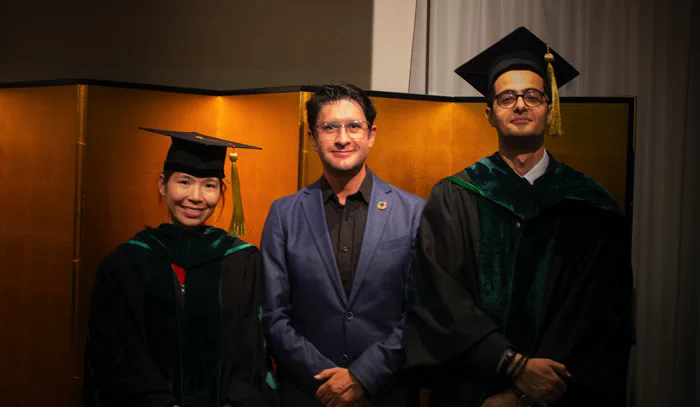
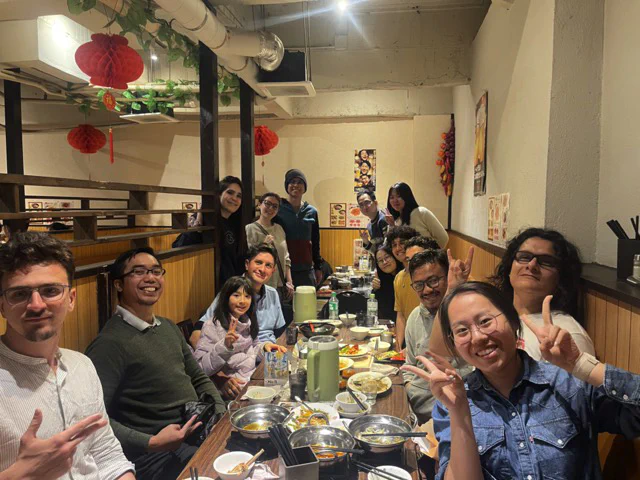
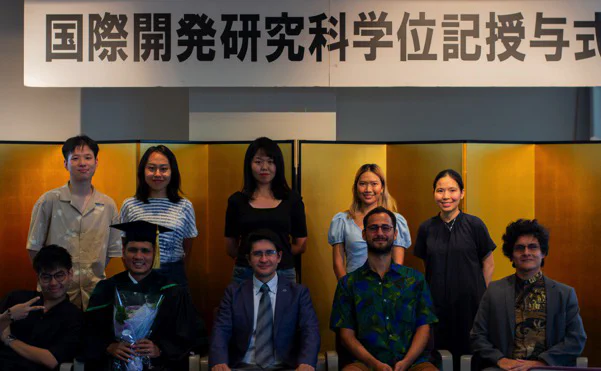
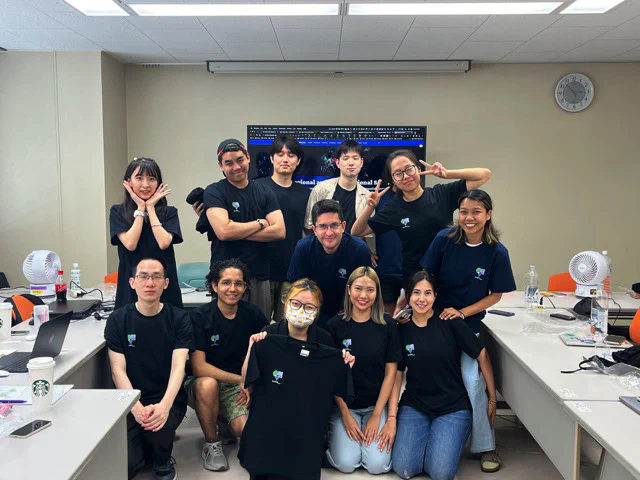
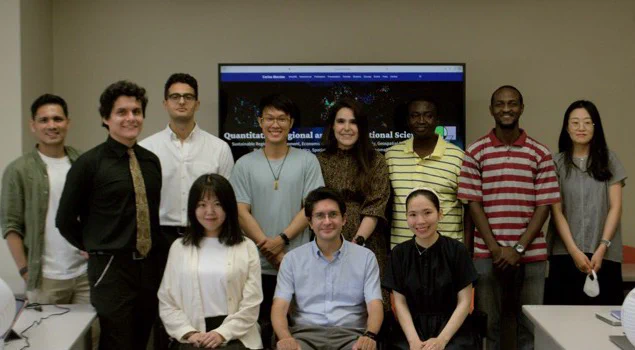
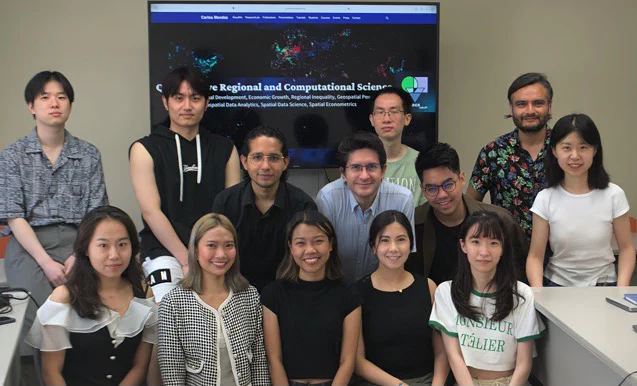
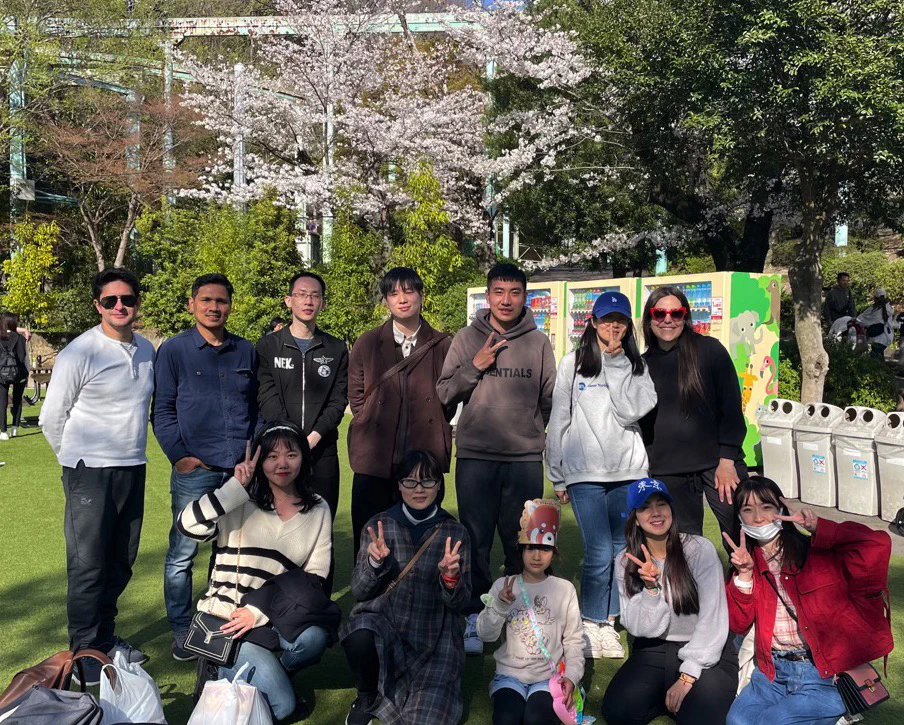
LIFE AT THE QUARCS LAB
A glimpse of life at the QuaRCS lab through the years.
Swipe or scroll horizontally to browse photos. Use the left and right arrow keys, or Home and End, when the gallery is focused.











03 / RESEARCH IN FOCUS
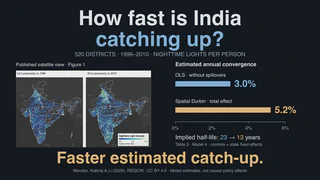
Satellite nighttime lights reveal how poorer districts in India catch up. Accounting for connections between neighboring districts raises the estimated pace of catch-up and shortens the time needed to close half the gap from about 23 to 13 years.
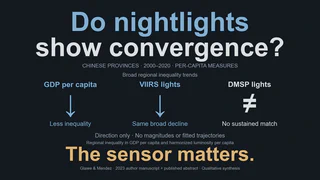
Satellite images of lights at night can track how China's provinces grow, but the link between light and income shifts over time and weakens during downturns. Newer satellite data measure economic activity more accurately than older data, especially for industry and services.
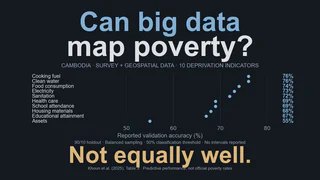
Up-to-date poverty data are scarce in Cambodia. We combine household surveys with satellite data, such as nighttime lights, and machine learning to map, down to the household level, where people lack basics like clean water, sanitation, electricity, and education.
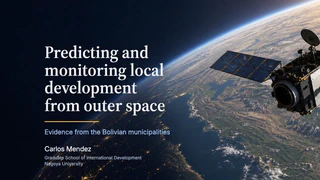
Predicting fifteen SDG indices for 339 Bolivian municipalities from nighttime lights and AlphaEarth daytime embeddings, and combining both satellite views to monitor local development clusters and spatial development traps.
Invited lecture (in Spanish) on how satellite imagery and spatial data science can measure, predict, and explain uneven development.
A framework for using artificial intelligence in learning and research while keeping the work reliable and transparent. It separates producing content from checking it and shows practical ways to combine these tools.
04 / SOFTWARE
Open-source Python packages for exploring panel data, measuring regional convergence and inequality, and estimating causal effects with spillovers.
What patterns and relationships hide in your panel data? expdpy reveals them in Python, with Plotly figures, publication tables, and no-code Streamlit apps.
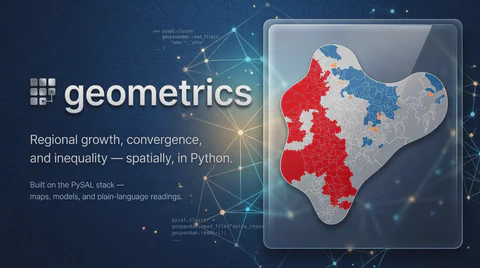
Explore packageAre poorer regions catching up, and is inequality falling? geometrics answers with spatial methods in Python, Plotly figures, and no-code Streamlit apps.
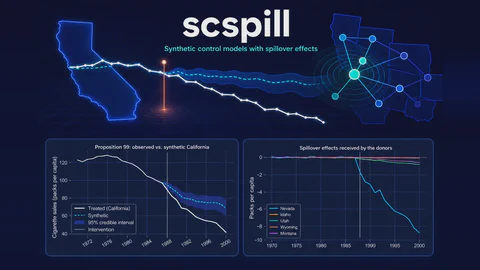
Explore packageDid a policy really work if it also affected the comparison regions? scspill, a Python package, estimates both the true effect and the spillover to them.
Explore package05 / THE OPEN CLASSROOM
Learn to map disparities, analyze regional change, and evaluate policy with practical tutorials in Python, R, and Stata. Work through the methods, then bring them to your own research.
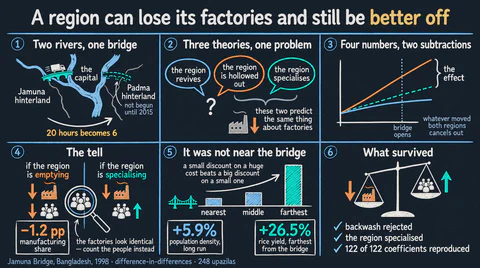
When a major bridge connected millions of people in northwest Bangladesh to the capital in 1998, did the region's economy take off? This beginner-friendly …
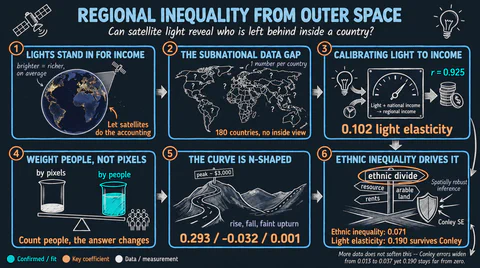
Start learningLearn how to turn satellite images of nighttime lights into estimates of regional income, then measure how unequal regions are within each country. Step by step …
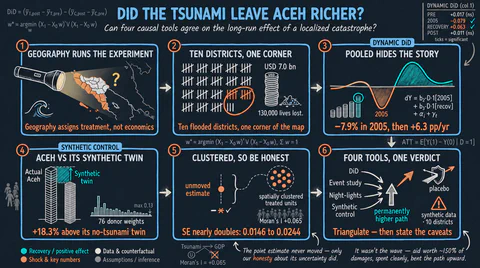
Start learningHow did the 2004 tsunami affect the economy of Aceh, Indonesia, over the long run? This beginner-friendly Python tutorial uses simulated data, nighttime lights, …
Start learning