Regional growth, convergence, and spatial spillovers in India: A reproducible view from outer space
Abstract
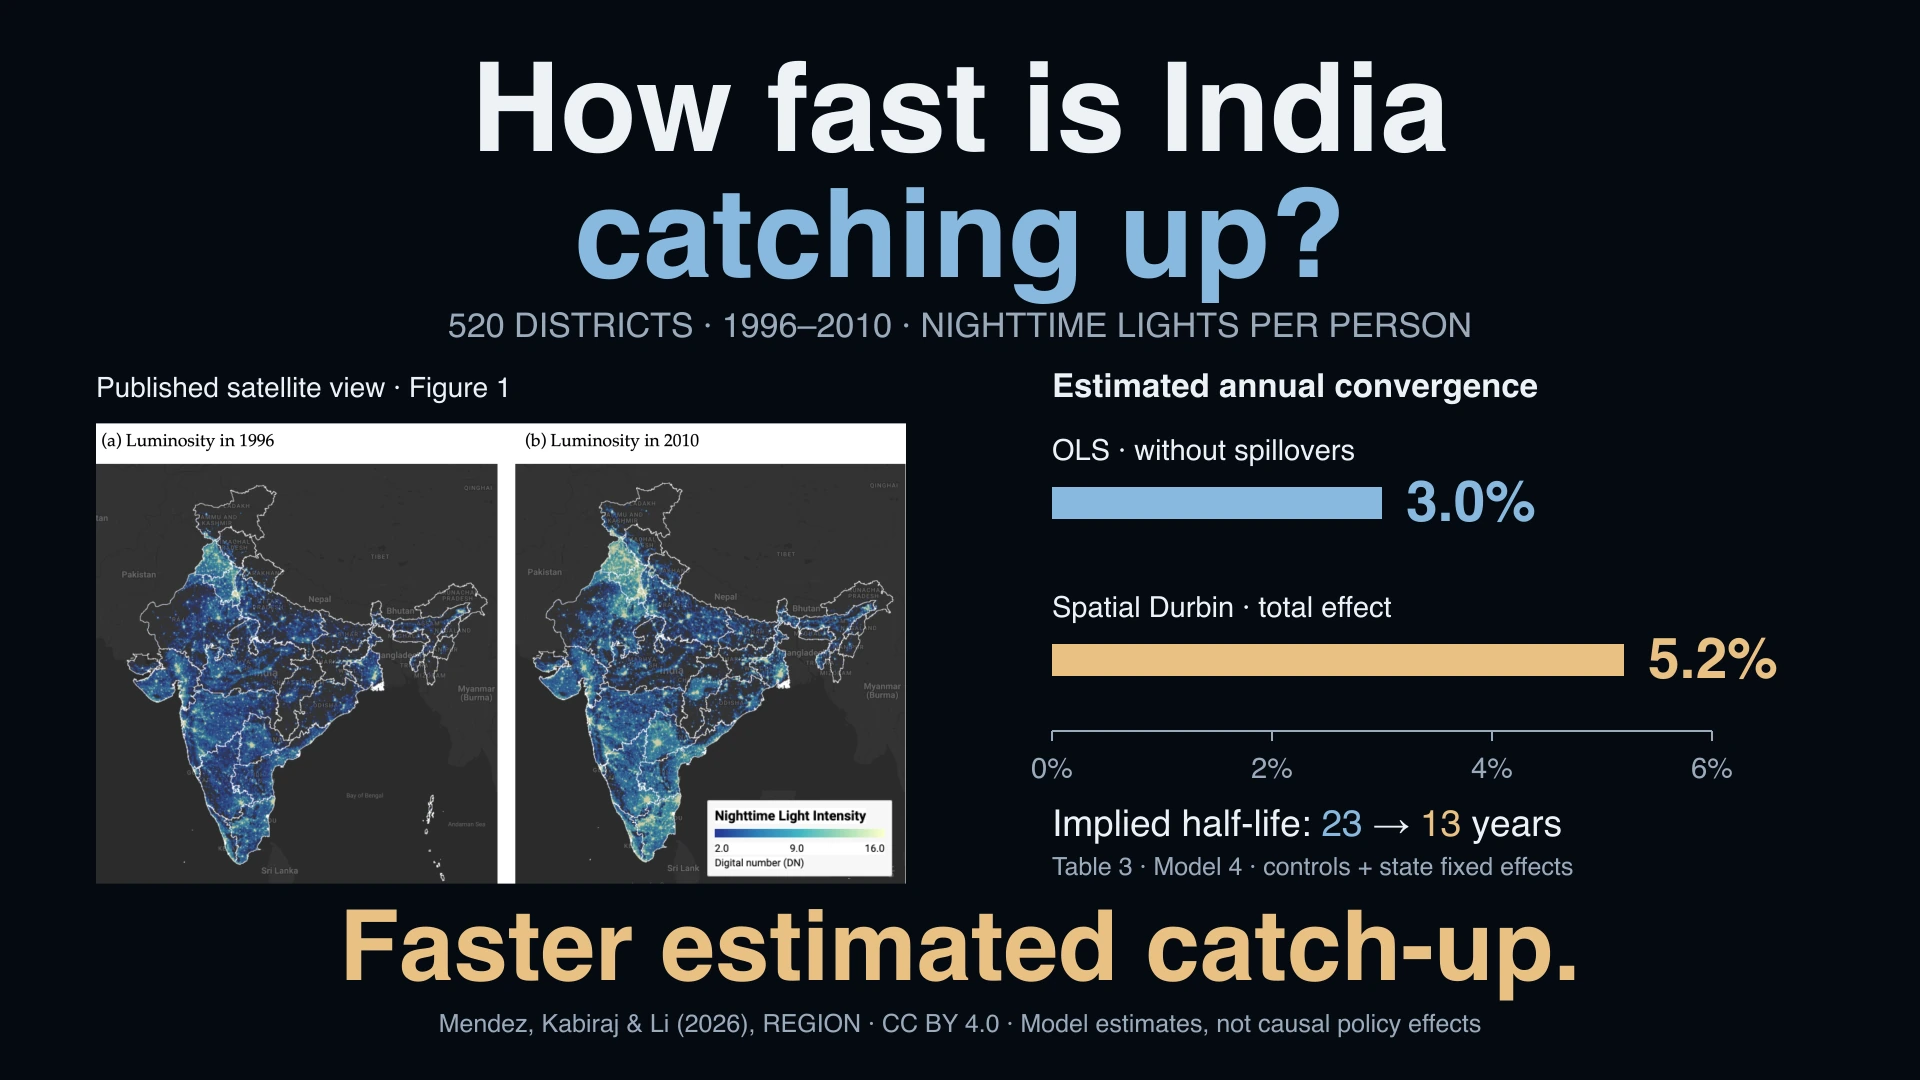
Using satellite nighttime light data as a proxy for economic activity, Chanda and Kabiraj (2020, World Development) studied regional growth and convergence across 520 districts in India. Adopting a reproducible open-science approach, this article builds on their work by extending their main findings on three empirical fronts. First, we illustrate regional convergence patterns using an interactive tool for satellite imagery visualization. Second, we assess the degree of spatial dependence in their main econometric specification. Third, we employ a spatial Durbin model to measure the role of spatial spillovers in the convergence process. Our results indicate that spatial spillovers increase the estimated speed of regional convergence. In our fully specified model, spillovers raise the convergence speed from about 3.0% to about 5.2% per year, which shortens the half-life of regional disparities from roughly 23 to 13 years. We close by illustrating how the same reproducible workflow extends beyond economic output, with an exploratory analysis of how luminosity relates to cultural participation across Indian states.
The question
Are poorer districts catching up with richer ones, and does the answer change when neighboring districts are connected? This article revisits growth across 520 Indian districts during 1996–2010, using satellite nighttime lights per person as a proxy for economic activity. It extends Chanda and Kabiraj (2020) through interactive visualization, tests of spatial dependence, and spatial spillover modeling.
What changes when neighbors enter the model?
The preferred specification includes control variables and state fixed effects. Comparing ordinary least squares with the total effects of a spatial Durbin model changes the implied pace of convergence:
| Model 4 estimate | Ordinary least squares | Spatial Durbin model |
|---|---|---|
| Annual convergence speed | 3.0% | 5.2% |
| Implied half-life of the gap | 23 years | 13 years |
These rounded values are reported in Table 3, page 184 of the published paper. Half-life means the time needed to close half the initial gap to the steady state under the model. It does not mean that every district reaches the same income level after 13 years.
The spatial model captures both local and neighboring associations. Robustness checks compare the baseline six-nearest-neighbor specification with six alternative spatial weight matrices: the direct and total convergence effects remain negative and statistically significant across all seven specifications (Table 4).
What the evidence can tell us
Spatial connections matter for how convergence is measured. The analysis does not identify the causal effect of changing one district’s conditions on another district’s growth. Shared geography, institutions, infrastructure, omitted variables, and light spilling across district boundaries can all contribute to spatial dependence. The estimates also summarize a single 14-year growth period rather than changes year by year.
A final exploratory analysis relates luminosity to cultural participation across Indian states. It illustrates how the reproducible workflow can be used beyond economic output; nighttime lights also reflect electrification and urbanization.
Learn by reproducing the analysis
The online article and learning materials connect each result to its source. Five analytical Python notebooks run in Google Colaboratory; the first notebook provides the interactive visualization and its Google Earth Engine script.
- N1: View from outer space — Explore nighttime lights with Google Earth Engine.
- N2: Regional convergence — Estimate catch-up, convergence speed, and half-life.
- N3: Spatial dependence — Build spatial weights and examine Moran’s I and local clusters.
- N4: Spillover modeling — Compare ordinary least squares and spatial Durbin models, including direct, indirect, and total effects.
- N5: Robustness — Check the preferred model using alternative spatial weight matrices.
- N6: Spatial culture — Explore luminosity and cultural participation across Indian states.
The GitHub repository contains the notebooks, data, and manuscript source. The interactive luminosity map lets you explore the satellite imagery directly.
Publication and image sources
Carlos Mendez, Sujana Kabiraj, and Jiaqi Li (2026). “Regional growth, convergence, and spatial spillovers in India: A reproducible view from outer space.” REGION, 13(2), 173–196. Published October 11, 2026. DOI: 10.18335/region.v13i2.676.
The infographic reproduces the authors’ Figure 1 luminosity map and plots the reported Model 4 values from Table 3. The map retains its original colors, geography, and scale; the surrounding layout and comparison chart are new. Article and source map: Mendez, Kabiraj, and Li (2026), CC BY 4.0.

Carlos Mendez
Associate Professor of Development Economics
My research interests focus on the integration of development economics, spatial data science, and econometrics to better understand and inform the process of sustainable development across regions.