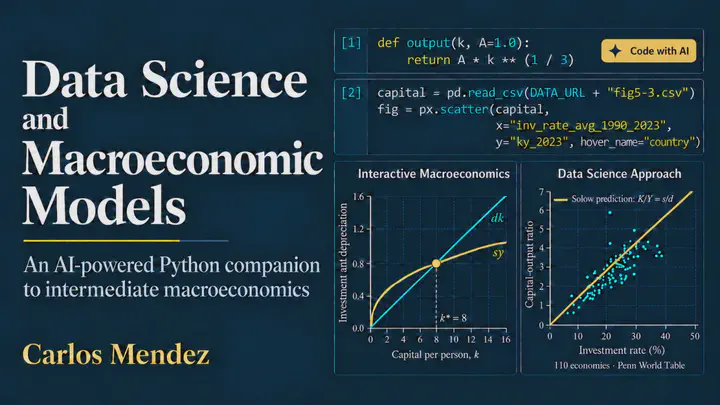
Data Science and Macroeconomic Models
An AI-powered Python companion to intermediate macroeconomics
Why have living standards risen so much, and why are some countries still much richer than others? What happens to output, unemployment and inflation when an economy enters a downturn? Data Science and Macroeconomic Models approaches these questions by putting real data and working models in readers’ hands.
Written by Carlos Mendez, this open online book is subtitled An AI-powered Python companion to intermediate macroeconomics. It accompanies Charles I. Jones’s Macroeconomics (2024). Its 21 chapters follow the textbook’s titles and order, while eight appendices progress from practical tools to economic growth and advanced model estimation. Read the economic reasoning in Jones, then use the matching notebook to investigate the evidence and operate the model yourself. The book is an independent companion, with its own code and figures, and is not affiliated with or endorsed by the textbook’s author or publisher.
The cycle of the book
The preface starts from a simple principle: economic explanations should be accountable to the facts. A broad pattern that persists across countries or over time becomes a stylized fact—something a useful model should help explain. Those patterns remain open to revision as new data arrive or the sample changes.
Each chapter moves through the same learning cycle: data → exploration → stylized facts → model → comparison with data → revision. The first three steps develop the data-science skills needed to find a pattern. The next three ask whether a model can account for it. A mismatch leads back to the data with a sharper question or to the model with a better explanation.

The point is to learn from both a model’s successes and its limits. The Solow model, for example, helps explain differences in prosperity, while the economics of ideas takes up the question of sustained growth. In Appendix G, comparison becomes estimation: readers use data to choose parameters and assess how well a model fits.
What you can do
- Investigate the data. Hover over observations, zoom into a period, compare countries and change variables. Public data sources include FRED, the World Bank, the IMF, the OECD and the Penn World Table; Appendix B explains how to retrieve data yourself.
- Operate the models. Move sliders to change parameters, introduce a shock or edit an equation in Python. Explore production and growth, the labor market and inflation, monetary policy, financial crises, and the links between domestic and international economies.
- See the reasoning and the code together. Chapters build a model from assumptions to predictions, then walk through figures with a purpose, the code that produces them and guidance on what to notice. “Your turn” exercises invite you to change the data or model and interpret the result.
- Use AI critically. An assistant can help explain or modify code, but a program that runs can still answer the wrong economic question. The preface asks readers to check the output and judge the evidence themselves.
How to work through a chapter
- Read the corresponding chapter in Jones for the economic argument, then open the book’s chapter below for its model overview and interactive figures.
- Follow the notebook link to Google Colab and choose Runtime → Run all. Run the code, change parameters and try the exercises. The main chapters require no local installation.
- Use the chapter’s slides for a lecture or a structured review of the same material. The links below open the actual chapter decks.
- Compare the model’s predictions with the data and explain what changed. If you are new to Python, begin with Appendix A; use Appendix C when you need a mathematics refresher.
Chapters, computational notebooks and slides
The resources below are organized in the same progression as the book. Chapter titles open the readable online chapters; Colab opens the executable computational notebooks; Slides opens the lecture decks. The linked materials are in English.
Foundations: Chapters 1–2
Begin with the questions macroeconomics asks and the tools used to measure the economy.
| Chapter | Notebook | Slides |
|---|---|---|
| 1. Introduction to Macroeconomics | Colab | Slides |
| 2. Measuring the Macroeconomy | Colab | Slides |
The long run: Chapters 3–8
Study production, capital accumulation, ideas, labor markets and inflation to understand long-run prosperity.
The short run: Chapters 9–15
Explore fluctuations, crises and stabilization policy, from the IS curve to dynamic stochastic general equilibrium models.
Applications and microfoundations: Chapters 16–20
Connect the models to household and firm decisions, government policy, trade and international finance.
Looking ahead: Chapter 21
Consider what macroeconomics has learned and the questions that remain open.
| Chapter | Notebook | Slides |
|---|---|---|
| 21. Parting Thoughts | Colab | Slides |
Eight appendices: tools, economic growth and DSGE models
The appendices now follow three complementary learning paths:
- Tools (A–C). Begin with Colab, Python and its data-science libraries; learn to retrieve macroeconomic data; and review the mathematics with Python calculations.
- Economic growth (D–F). Use the Penn World Table to separate GDP growth and income gaps into contributions from capital, labor and productivity. Explore whether poorer countries catch up through measures of convergence, then add human capital to the Solow model and replicate the cross-country analysis of Mankiw, Romer and Weil (1992).
- DSGE models (G–H). Write, solve and estimate macroeconomic models with Snowdrop. Appendix G includes maximum-likelihood and Bayesian estimation of Ireland’s (2004) New Keynesian model on U.S. data. Appendix H solves the estimated Smets–Wouters model and recomputes the impulse responses presented in Chapter 15.
Appendix B installs its additional data libraries in the first code cell; G and H install Snowdrop there. All eight appendices now have computational notebooks and lecture slides.
Who the book is for
The book welcomes undergraduate and master’s students, self-learners, data-science learners looking for economic applications, and economists who want practical Python experience. No prior programming experience is assumed. Readers interested in economic growth can explore Appendices D–F, while G–H connect macroeconomic models with solution and estimation.
Start with the preface, choose a chapter above, or begin with Appendix A if you are new to computational notebooks.

Carlos Mendez
Associate Professor of Development Economics
My research interests focus on the integration of development economics, spatial data science, and econometrics to better understand and inform the process of sustainable development across regions.