At 01:30, the light that remains is installed infrastructure
The idea
The VIIRS satellites cross the equator at about 01:30 local time. Homes and shops are dark; streets, highways, ports, industrial estates and public buildings are still lit.
97.3%brightness lost overnight by a sports field (activity lighting)
4.6%lost by an administrative building (infrastructure lighting)
We read night light as a measure of infrastructure, not of income.
Drone evidence from Wuhan: Li et al. (2020).
325 regions, eleven years, three questions
Data and roadmap
278 first-level regions in the ten ASEAN member states + 47 Japanese prefectures · VIIRS 2014–2024 · brightness around the average resident (population-weighted)
1. AccessCan access to infrastructure be seen from orbit?Section 2 · Jiang Qian
2. InequalityIs the gap between regions closing?Section 3 · Li Xiaomeng
3. DisasterCan we see infrastructure fail and recover?Section 4 · Carlos Mendez
NASA already maps access from orbit, but only once
1 · Access
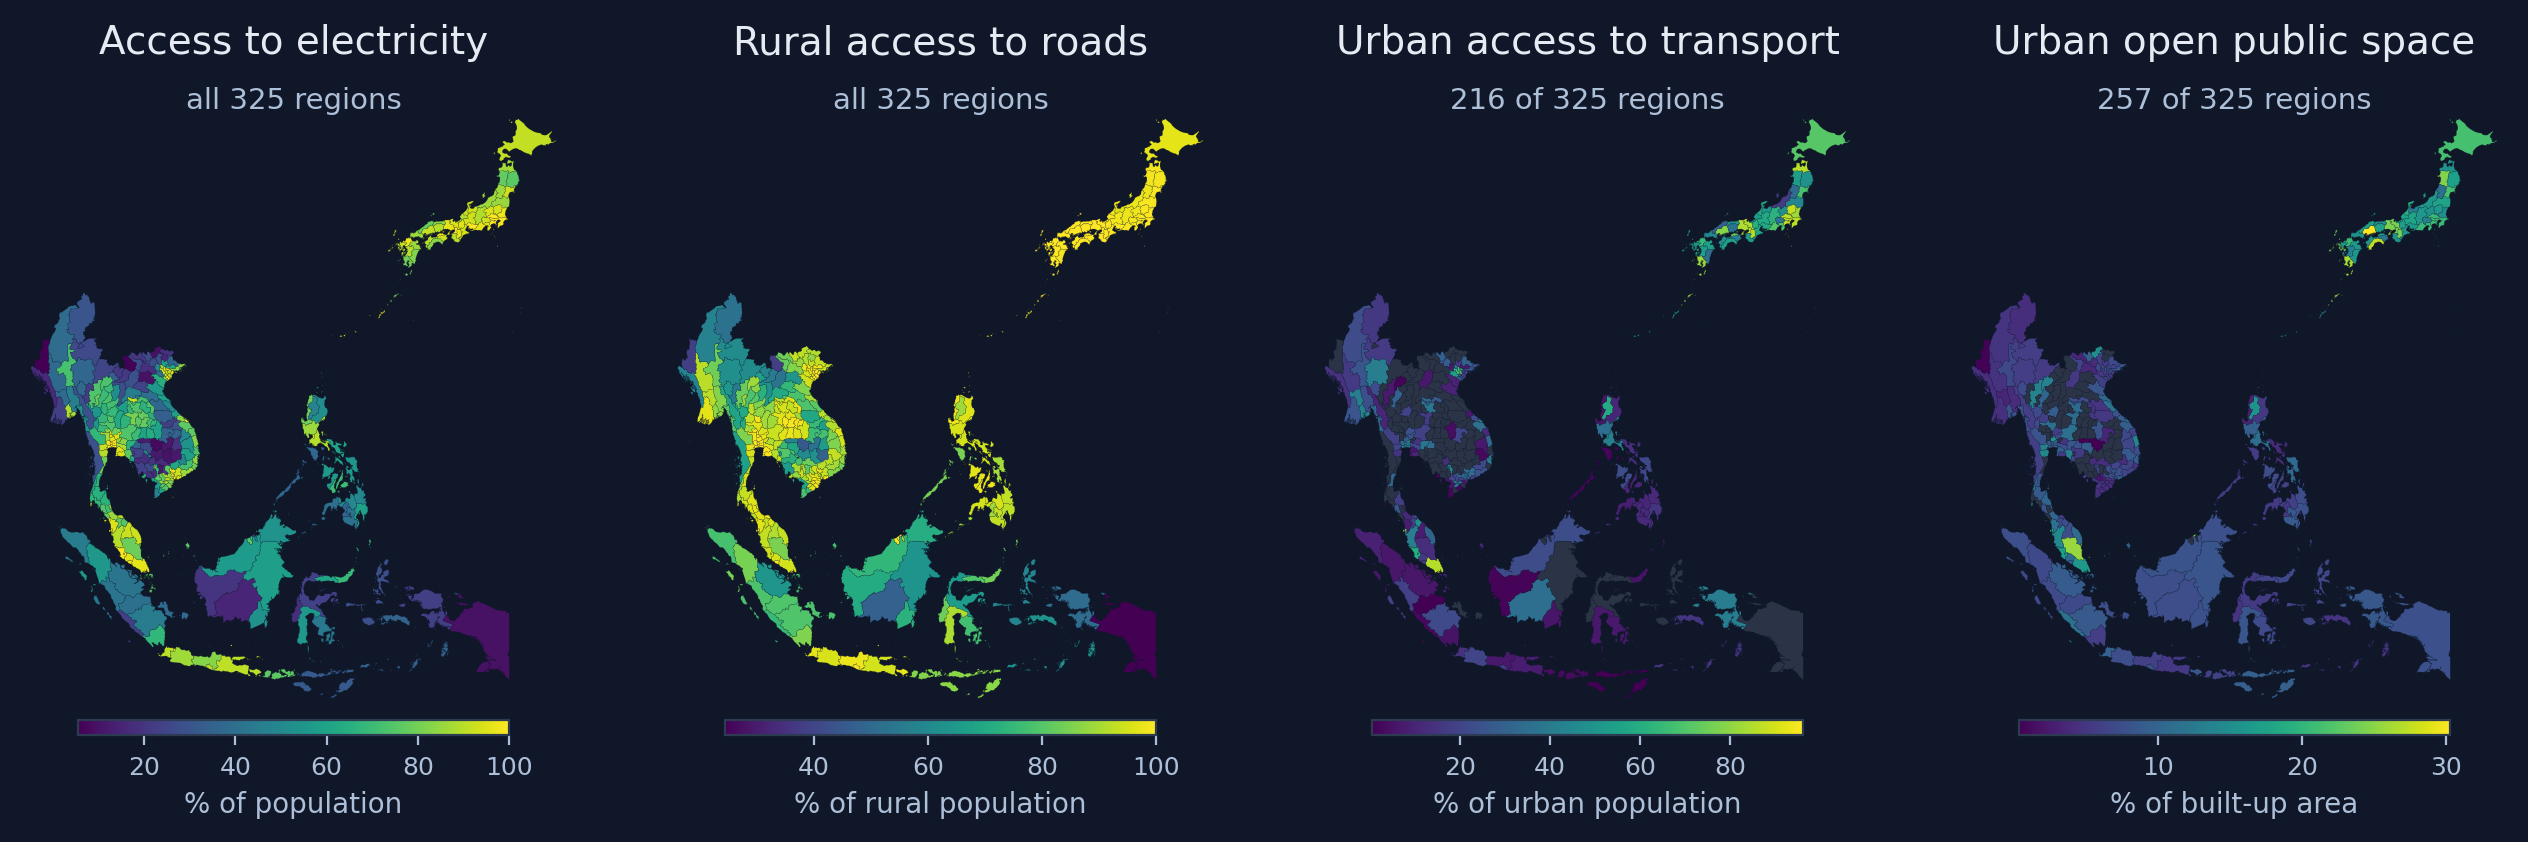
Four Sustainable Development Goal access indicators built from Earth observation, 325 regions (NASA SEDAC / CIESIN, 2023 release). Grey: indicator not defined.
Each indicator is a single snapshot: none can tell us whether access is improving.
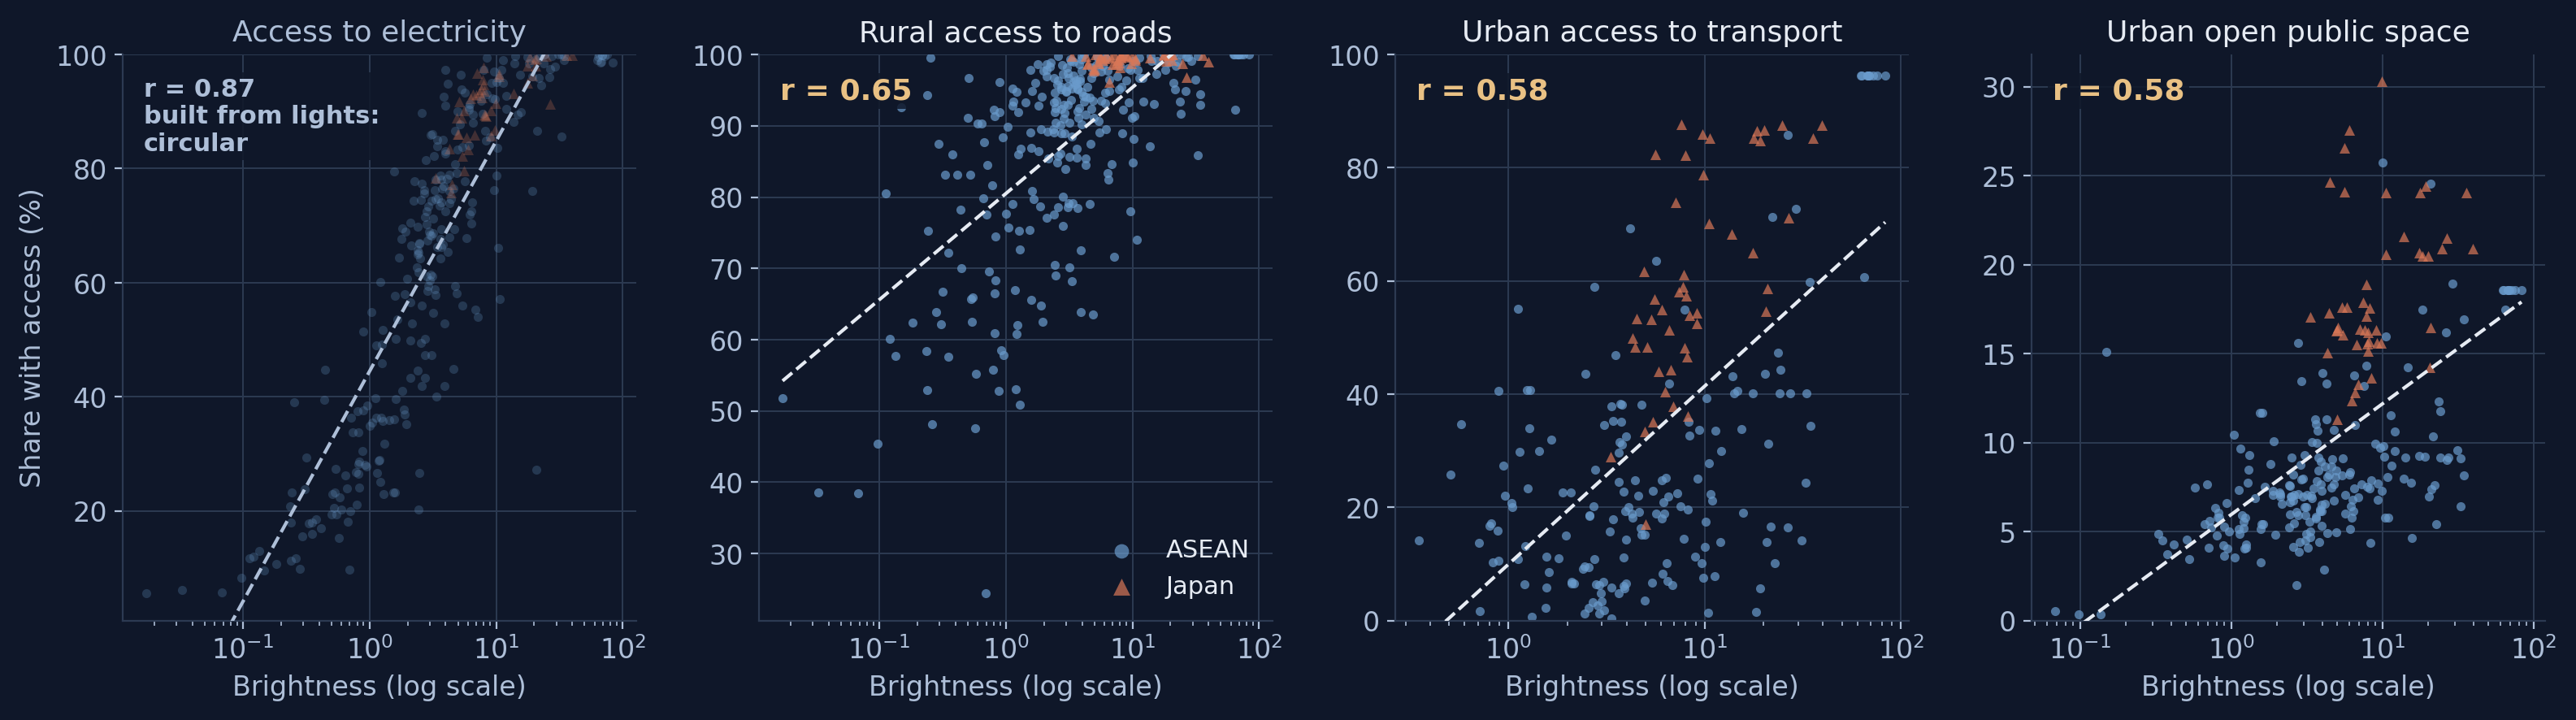
Brighter regions have better access to infrastructure
1 · Access
Brightness around the average resident against each access indicator, 2020. Dashed: fitted line.
Lights agree with three indicators that use no lights at all: roads 0.65, transit 0.58, open space 0.58. And lights are annual since 1992.
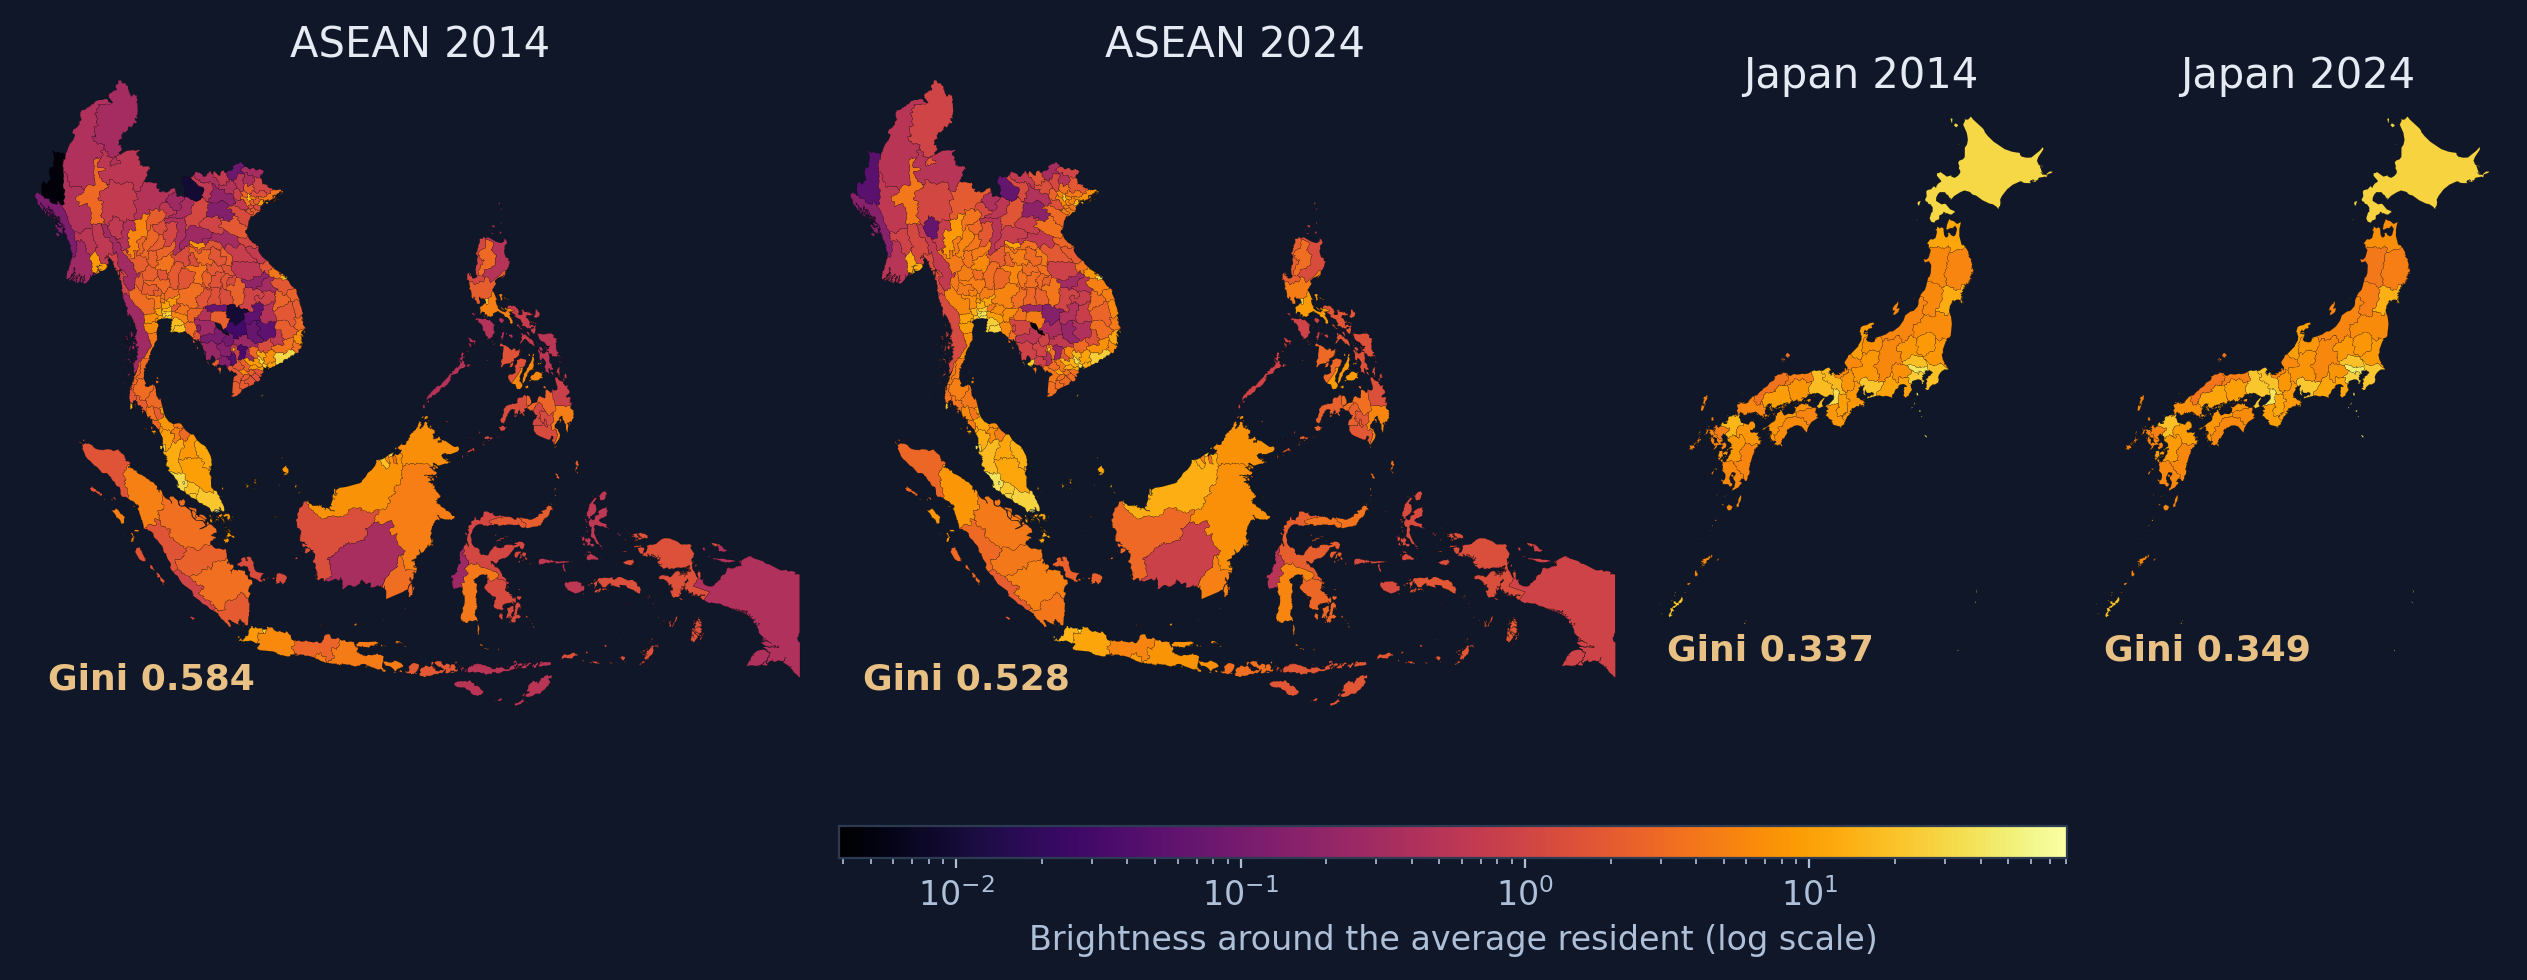
ASEAN brightened, and its darkest regions brightened most
2 · Inequality
Brightness around the average resident by region, one log colour scale for all four maps; gold: the gap score (population-weighted Gini).
Japan is near-uniformly bright; its 2014 and 2024 maps are hard to tell apart.
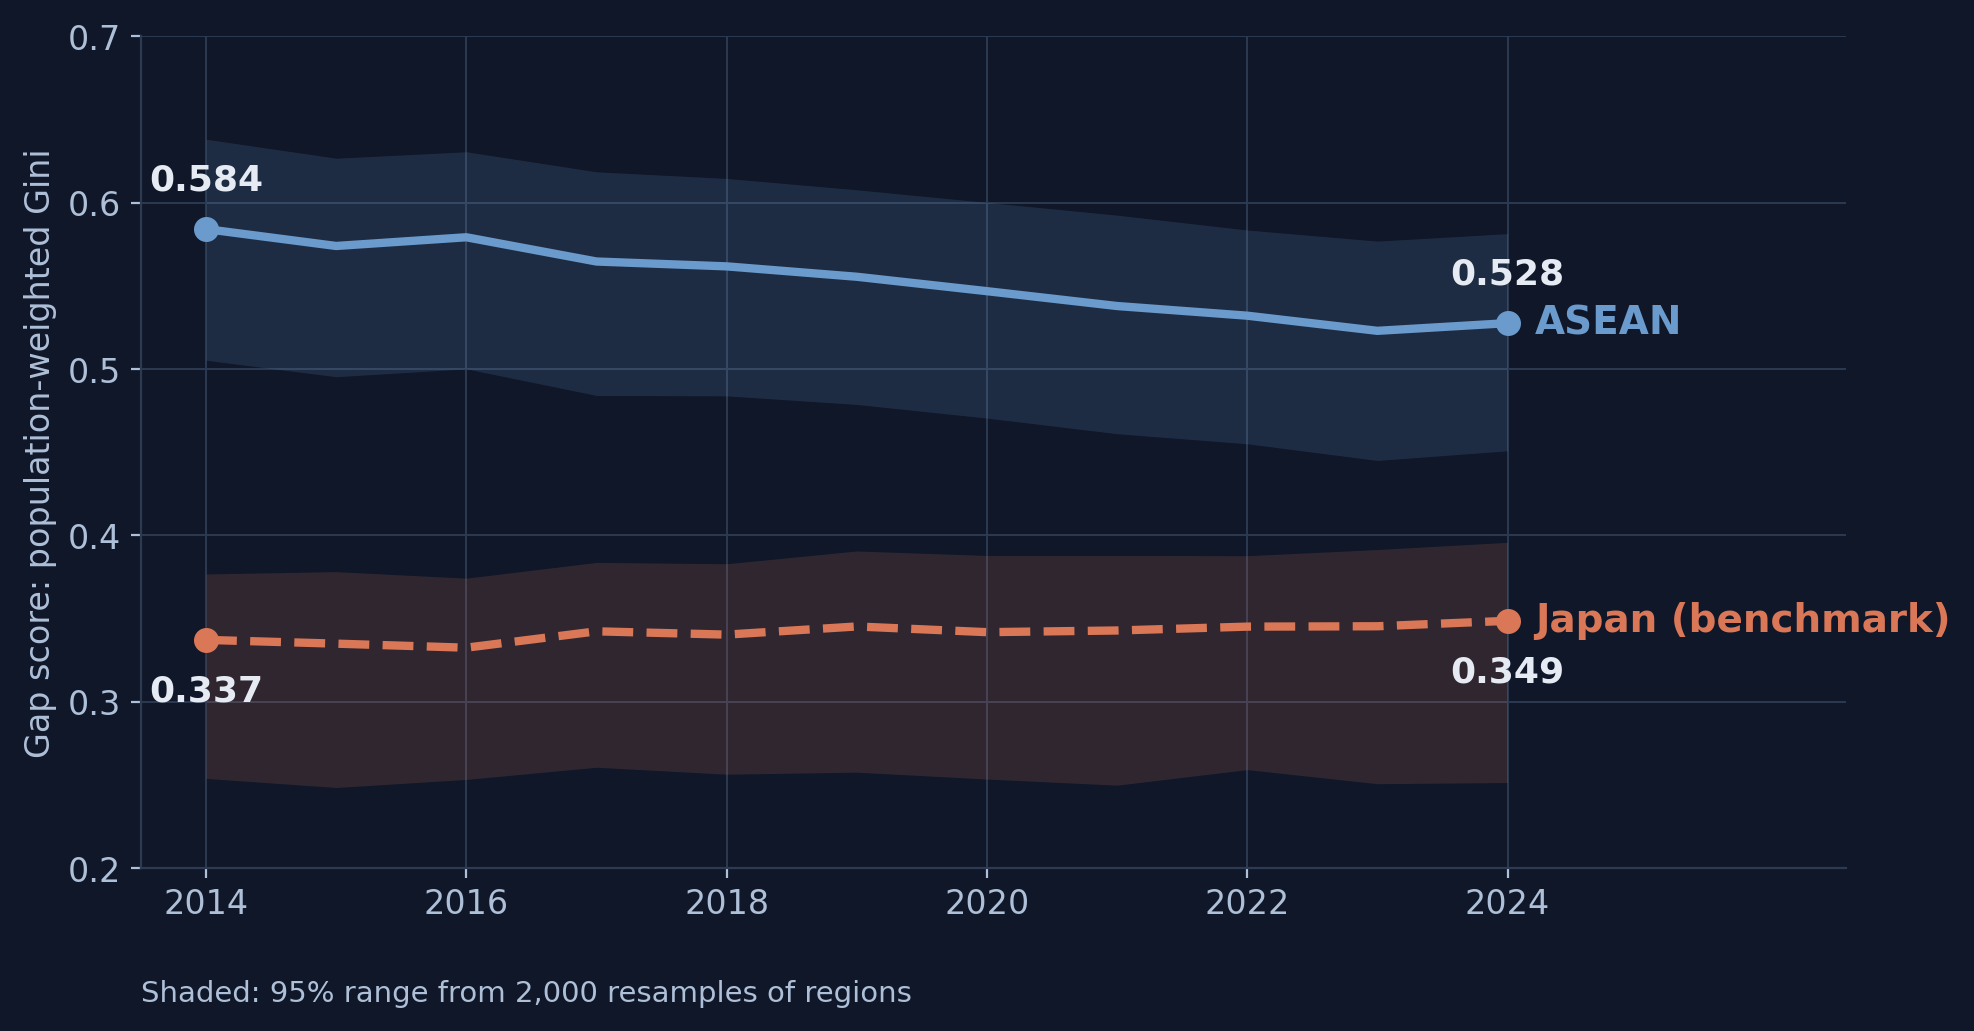
Regional inequality fell while Japan stayed flat
2 · Inequality
Gap score across 278 ASEAN regions and 47 Japanese prefectures, 2014–2024.
ASEAN: −0.057 (95% range −0.072 to −0.042), while average brightness rose. Levelling up, not levelling down.
Half of ASEAN lived below Japan’s dimmest prefecture. Now a third does.
2 · Inequality
50.7% → 31.5%
share of the ASEAN population living in regions dimmer than Shimane, 2014 → 2024 (191 → 135 of 278 regions)
This is the single number we would put in front of a finance ministry.
One shock, three exposures: a synthetic control for each prefecture
3 · Disaster
11 March 2011: the Great East Japan Earthquake hit Fukushima, Miyagi and Iwate. Only Fukushima also had a nuclear accident and a long evacuation.
22 untouched prefecturesthe donor pool
→
Weighted blendmatched to the prefecture over 1994–2010
→
Synthetic controlwhat would have happened without the quake
→
Effectthe gap that opens after March 2011
Run three times, unchanged: official output, annual light, then monthly light.
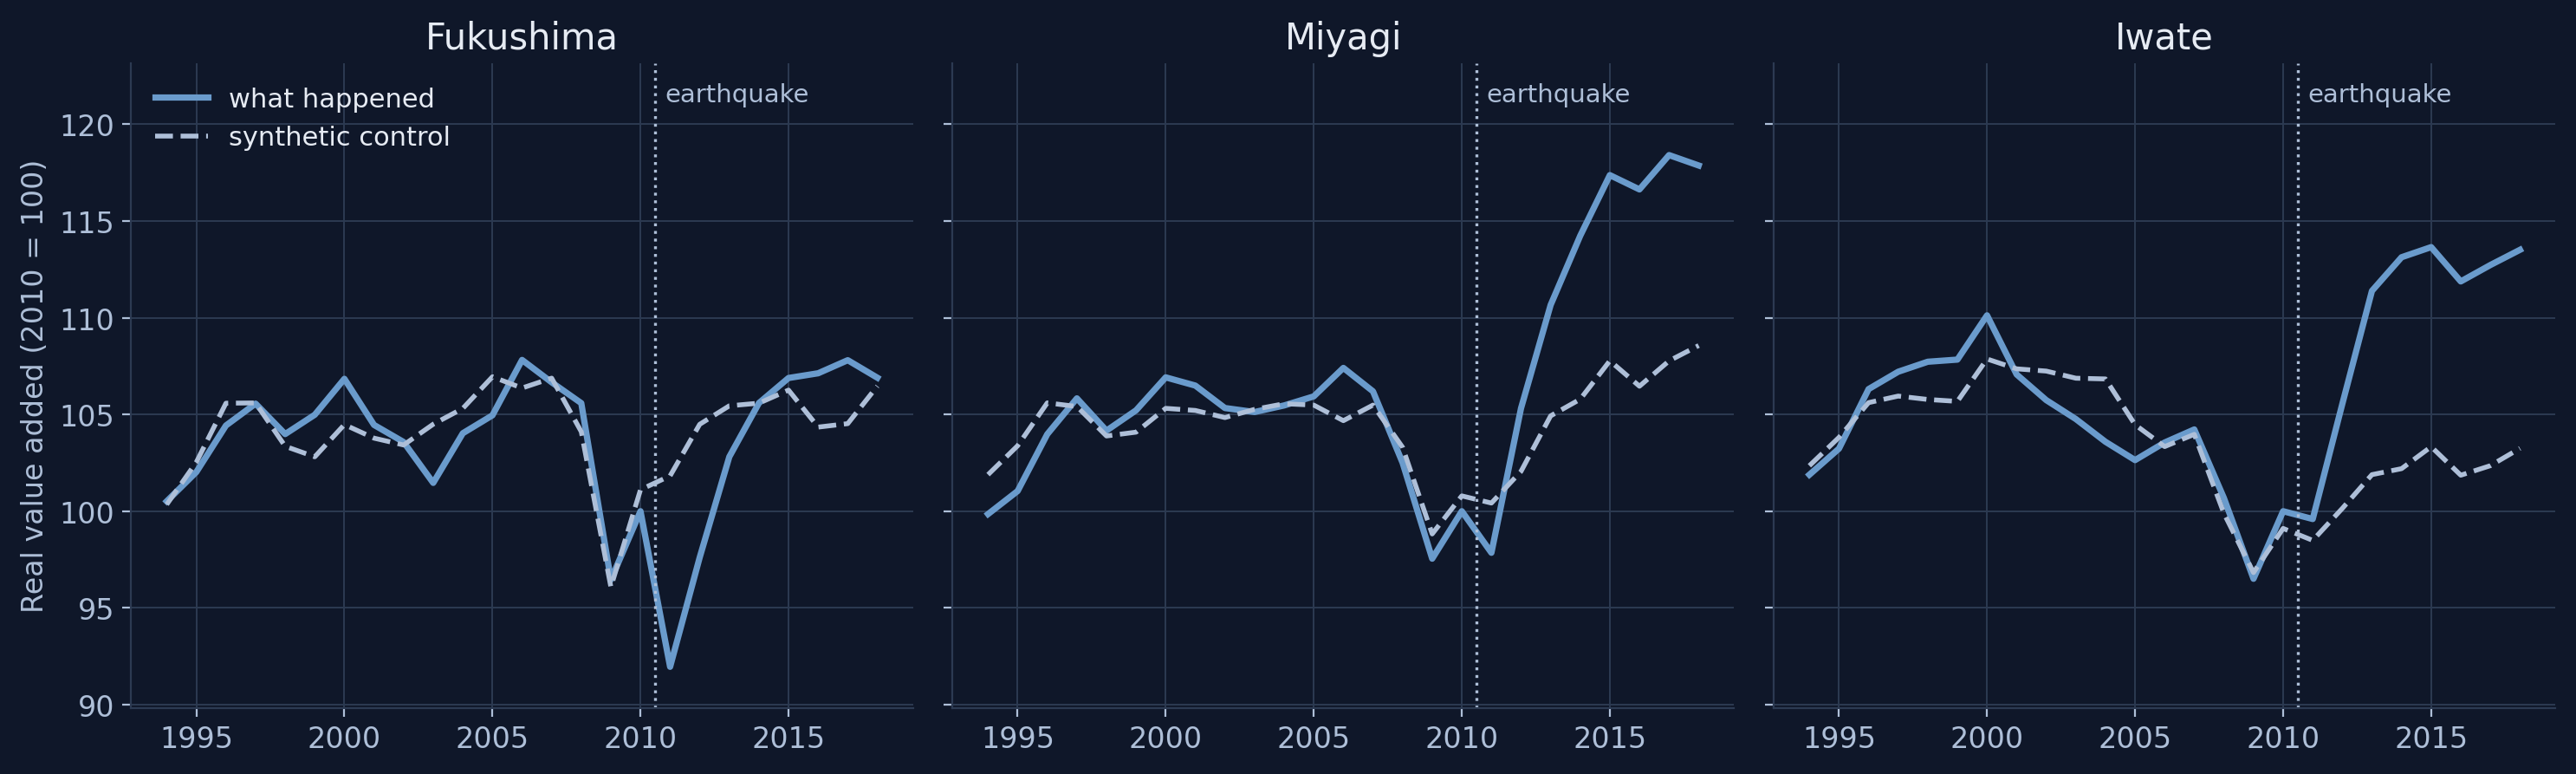
Official output: Fukushima fell deepest; Miyagi and Iwate ended above
3 · Disaster
Real value added (solid) and its synthetic control (dashed), 2010 = 100.
2011: Fukushima −9.7%, Miyagi −2.6%, Iwate +1.1%. By 2018 all three are above their synthetic controls: reconstruction money, not a benefit from disaster.
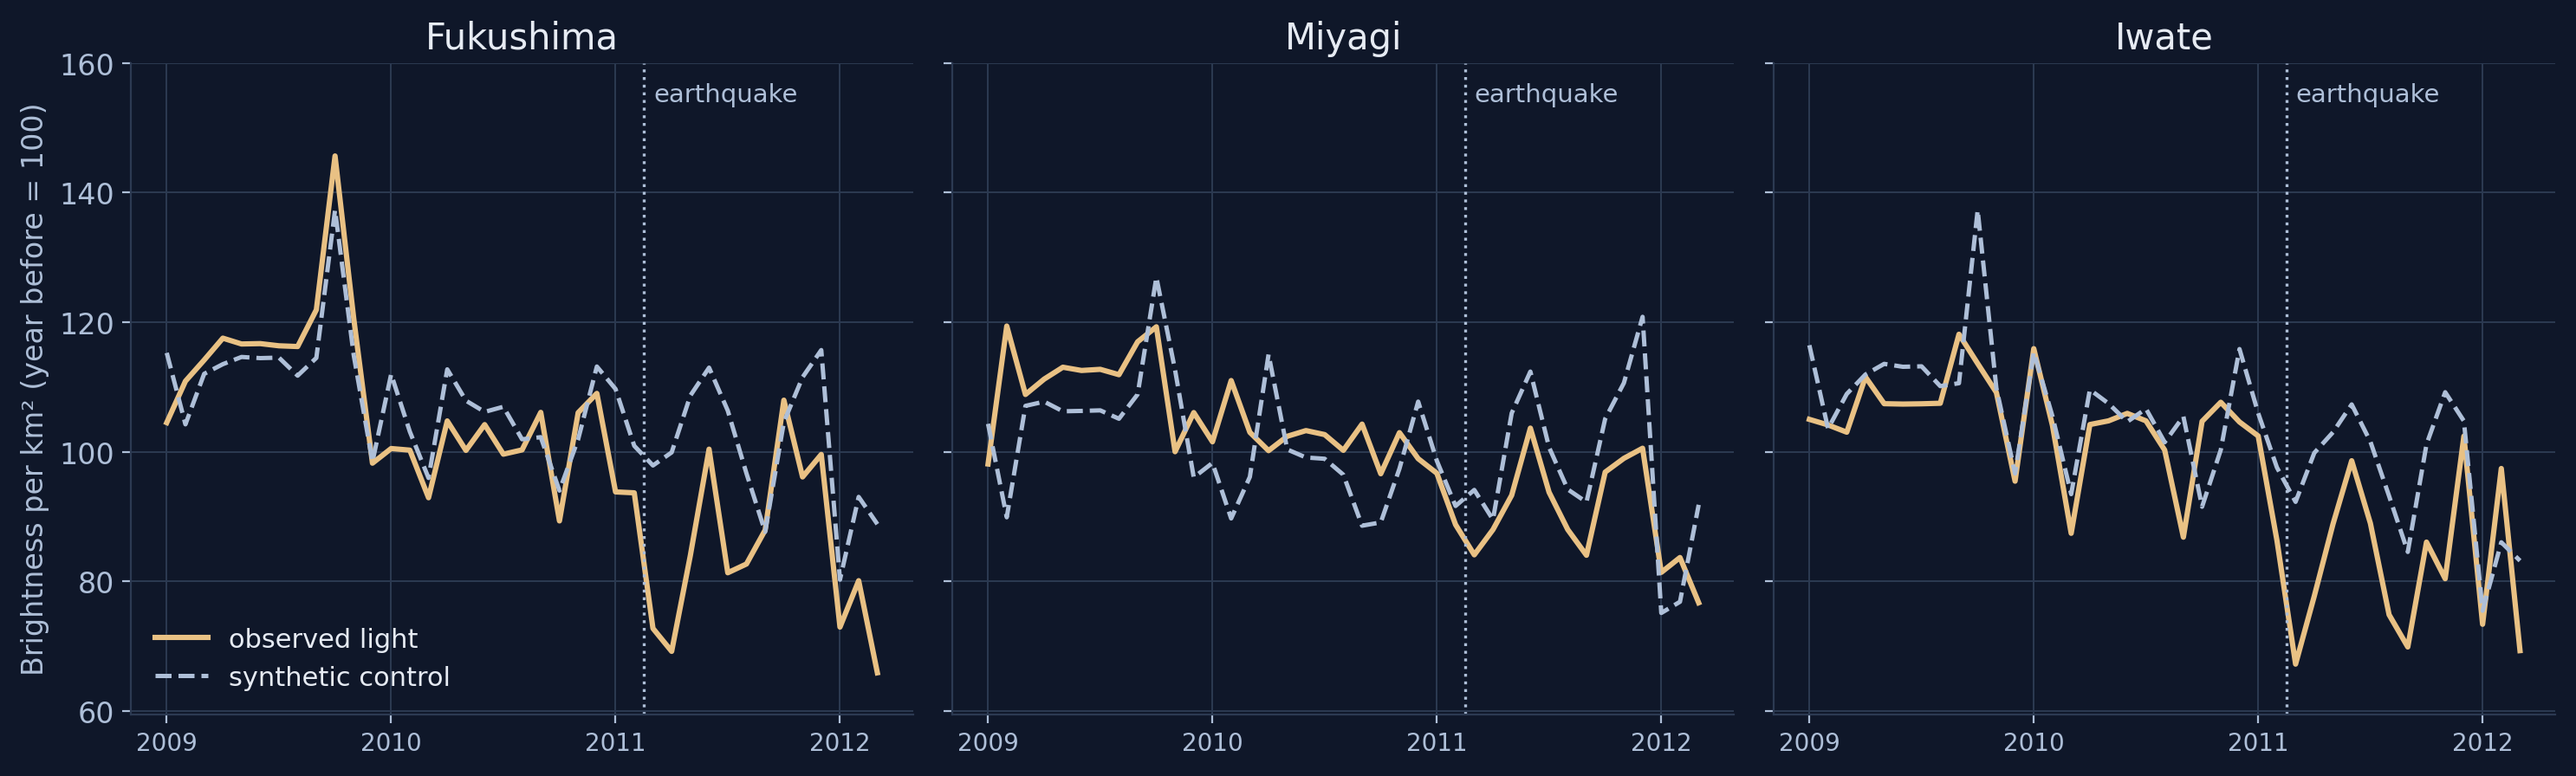
Monthly light drops in the month of the quake, in all three
3 · Disaster
Brightness per km² against its synthetic control, month by month (year before = 100). Matched over 206 pre-quake months.
March 2011: Fukushima −25.7%, Miyagi −10.6%, Iwate −27.1% below the synthetic control.
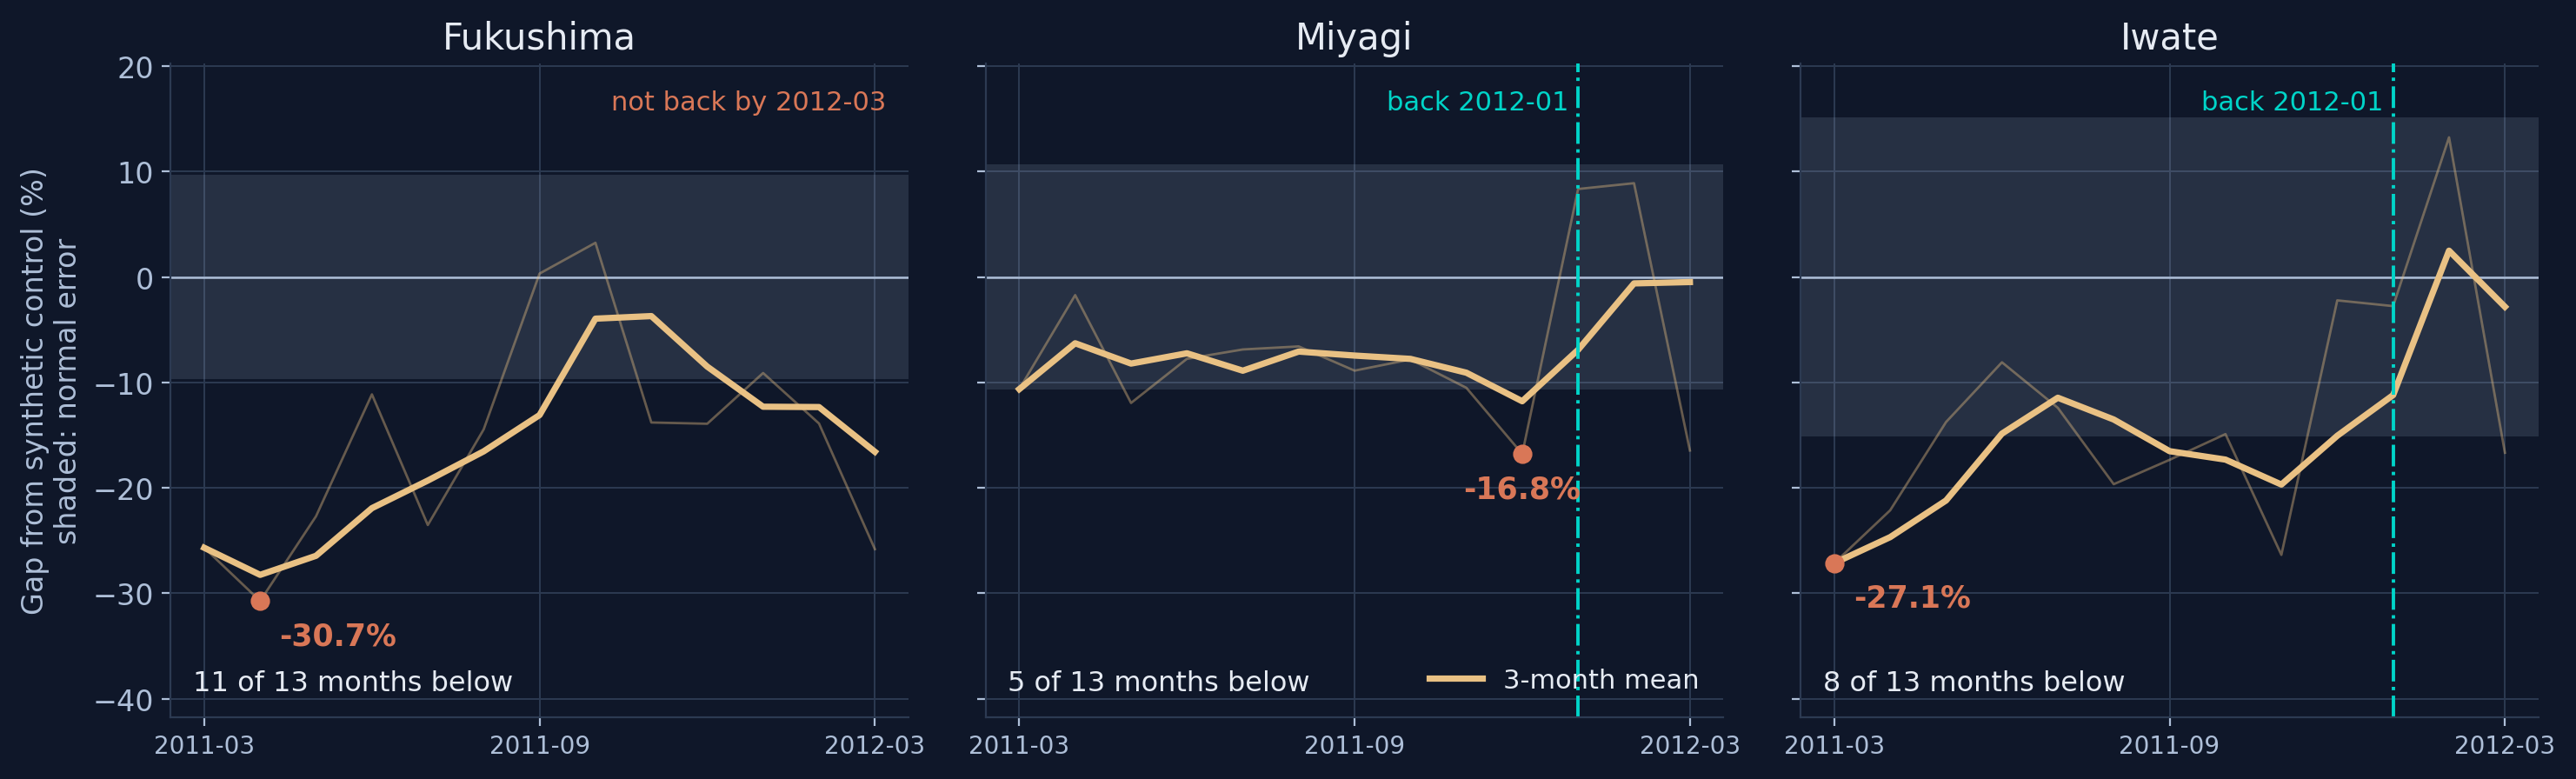
Depth is not duration: Fukushima stays down longest
3 · Disaster
Gap from the synthetic control (%); shaded band = each prefecture’s normal error before the quake; heavy line = 3-month mean.
Fukushima bottoms at −30.7% and is below its normal error 11 of 13 months; Iwate 8, Miyagi 5. Annual data cannot make this distinction.
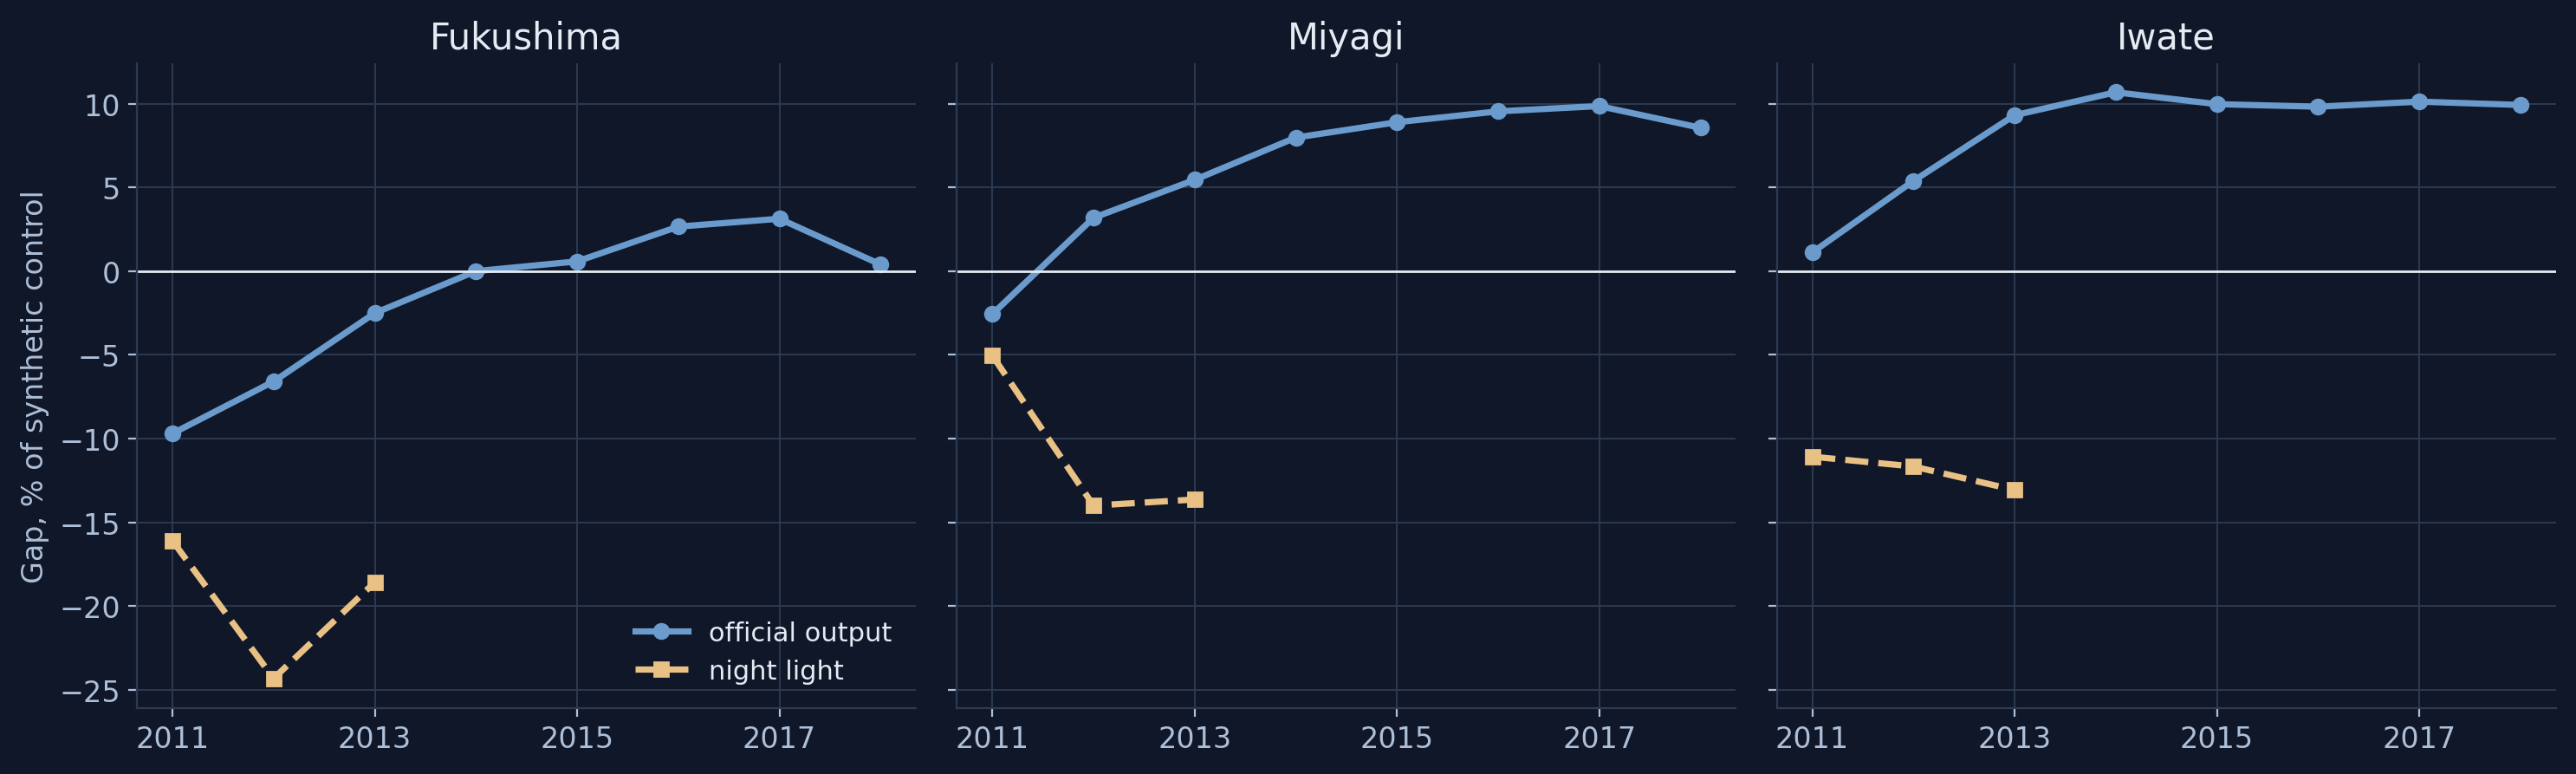
Output recovers with reconstruction; light returns only with infrastructure
3 · Disaster
Each gap as a percentage of the synthetic control: official output (solid) and night light (dashed), from 2011.
The two measures agree about the first year, then diverge. Rebuildable damage and denied access are different problems.
Three policy outputs from one instrument
Implications
Target lagging clustersPersistent dark regions straddle borders (Myanmar–Lao PDR–Cambodia–Thailand uplands, Borneo). Target clusters, not countries, in line with ASEAN connectivity corridors.
Deficit or vulnerability?Are the places hit deepest and longest the ones already behind? If yes, one budget line; if not, two.
An annual monitorUpdated every year at negligible cost, one tier below the nation. We propose a public dashboard that ADBI could host.
Next step: daily light. Blackouts last about four days; monthly composites average them away.
Thank you
Infrastructure, inequality and disaster recovery can all be monitored from outer space using new nighttime lights.
Carlos MendezNagoya University
Li XiaomengNagoya University
Jiang QianIndependent researcher
Chapter for the ADBI volume Building Sustainable Infrastructure in Asia and the Pacific
B1 · How strongly lights agree with each access indicator
Indicator
Built from
N
Raw r
Within r
Net r
Spearman ρ
SDG 7.1.1 Electricity (circular)
VIIRS + population
324
0.87
0.81
0.76
0.90
SDG 9.1.1 Rural road access
OSM + GHSL + population
324
0.65
0.47
0.39
0.68
SDG 11.2.1 Urban transit access
OSM + GHSL + population
216
0.58
0.37
0.35
0.51
SDG 11.7.1 Urban open public space
OSM + GHSL
257
0.58
0.27
0.54
0.64
Within: each country’s mean removed from both sides. Net: log population and log area held fixed. Luminosity in logs, 2020. Transit exists only where a mapped urban centre exists (216 regions).
B2 · Within-country inequality, 2014 versus 2024
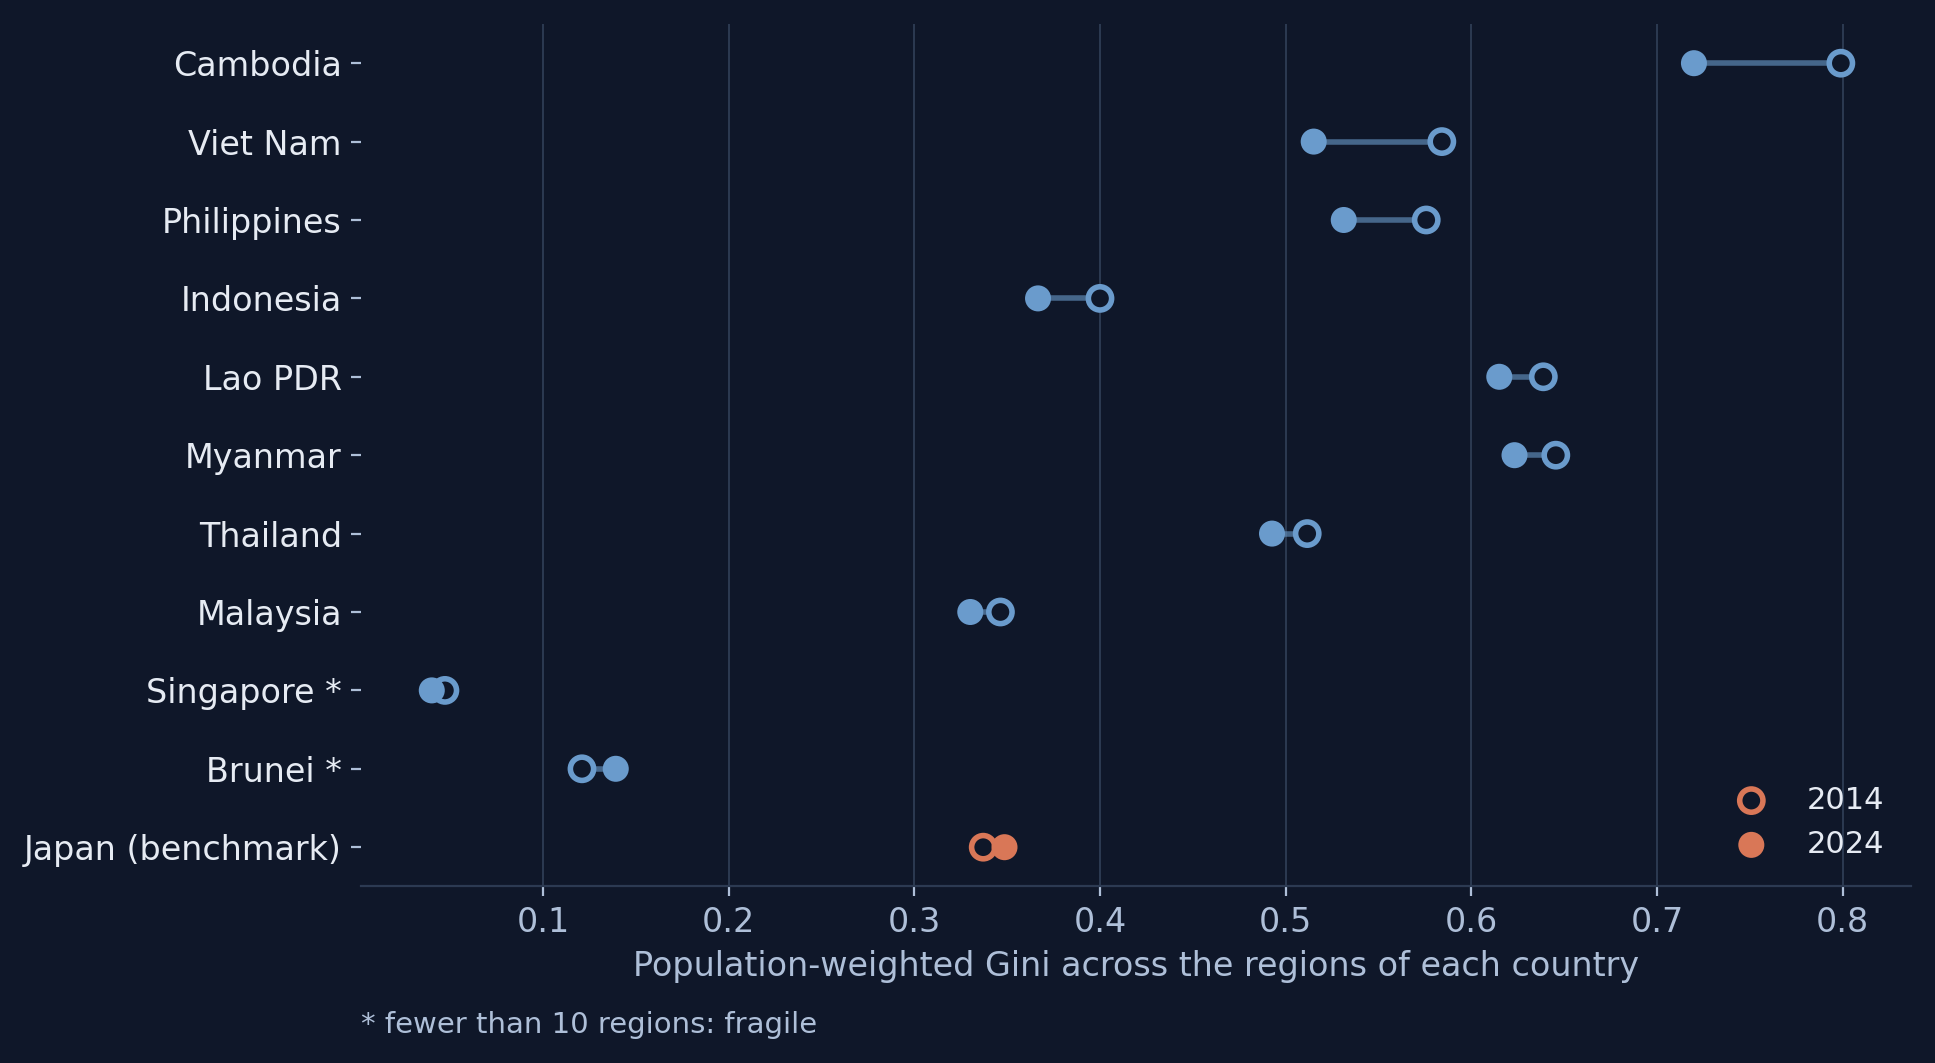
Population-weighted Gini across each country’s own regions.
9 of 10 member states fall, but only 3 have a 95% range excluding zero: Viet Nam, the Philippines, Thailand.
B3 · The inequality decline is robust
Specification (ASEAN)
Regions
Gini 2014
Gini 2024
Change
95% range
Headline (population-weighted)
278
0.584
0.528
−0.057
[−0.072, −0.042]
Unweighted (one weight per region)
278
0.714
0.635
−0.079
[−0.089, −0.067]
Excluding ever-dark units
276
0.584
0.528
−0.057
[−0.072, −0.041]
Excluding Singapore
269
0.565
0.516
−0.050
[−0.063, −0.036]
Excluding Myanmar
261
0.572
0.512
−0.060
[−0.076, −0.044]
Paired region bootstrap, 2,000 draws, each region resampled with its full 11-year path.
B4 · Official output against every untouched prefecture
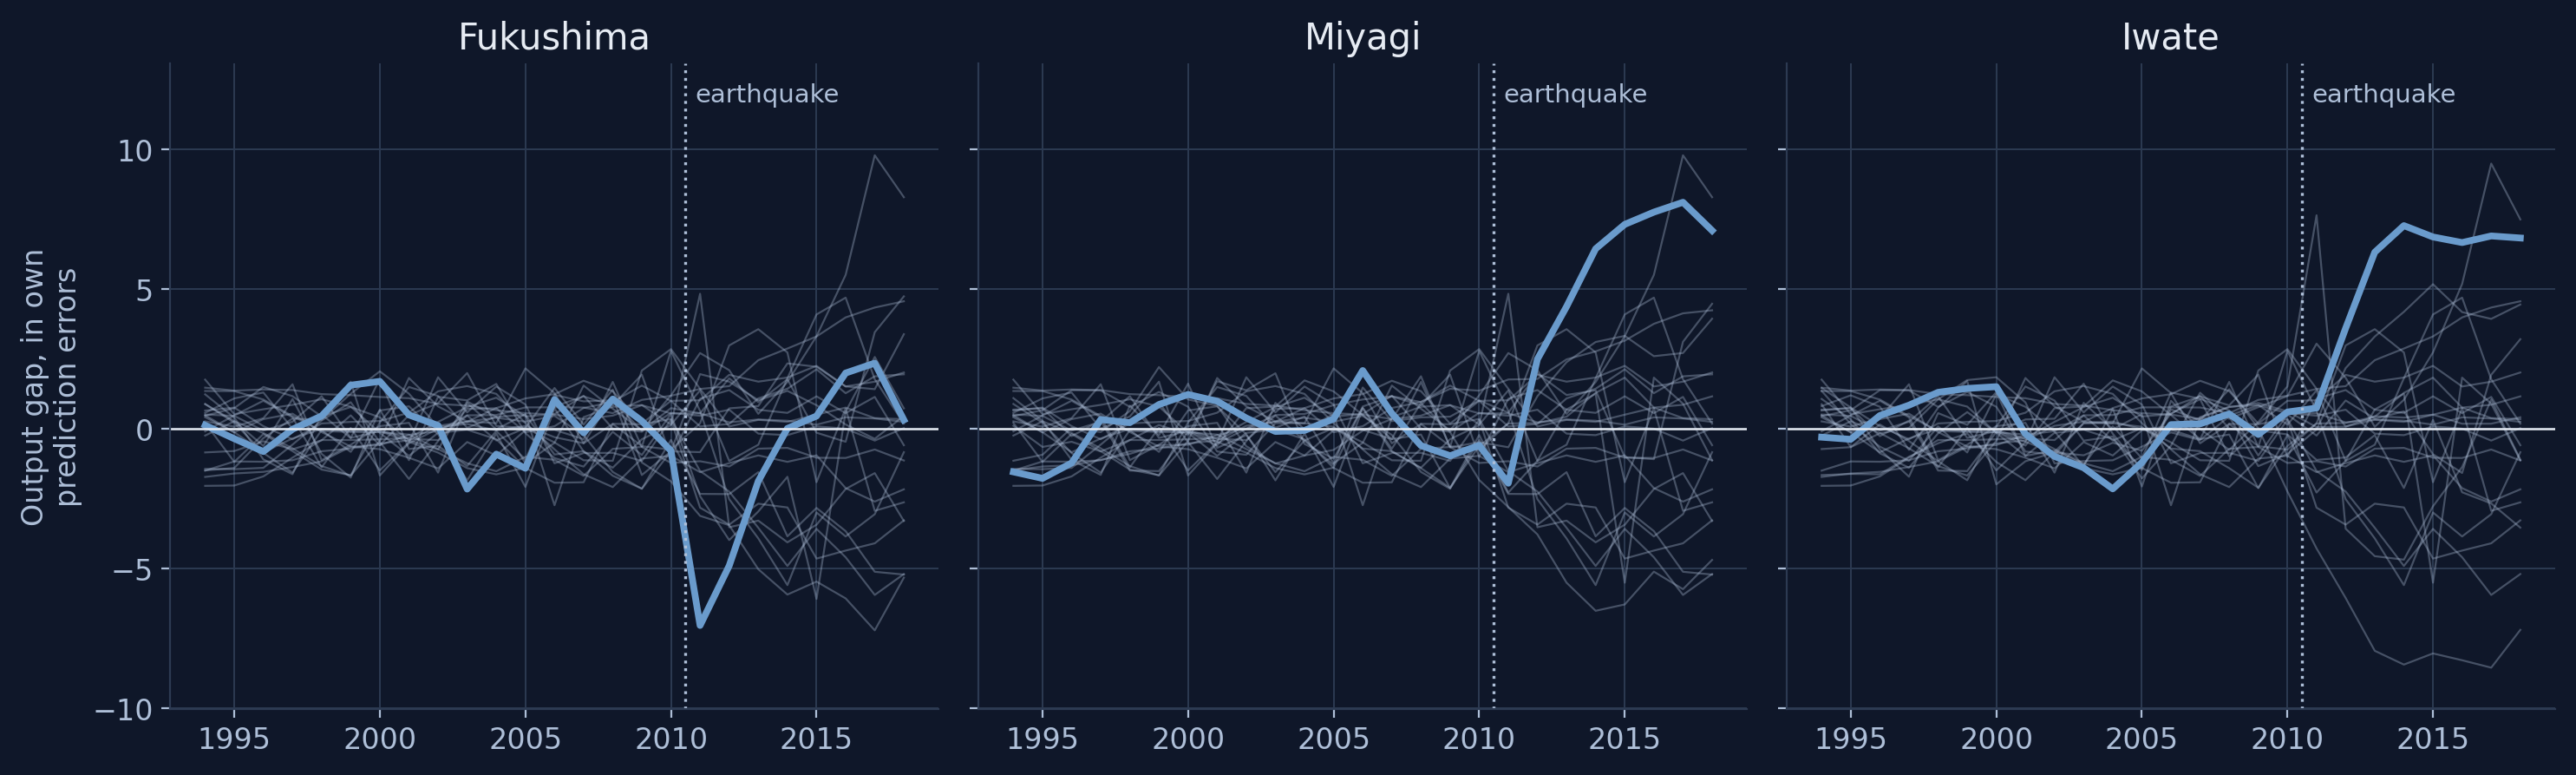
Gap in units of each prefecture’s own pre-quake prediction error; grey: the 22 donors refitted as if treated.
Placebo p-values: Miyagi 0.043, Iwate 0.087, Fukushima 0.348. The test rewards large, sustained departures, so it sees the reconstruction response more clearly than the damage.
B5 · Is the monthly light record usable? A pre-registered gate
Check
Measured
Bound
Result
Consequence
Year-on-year same-month difference
0.945
0.600
pass
—
Lag-12 over lag-1 autocorrelation
0.964
0.600
pass
—
Month-to-month volatility
0.948
0.600
pass
—
Monthly composites average to the annual panel
0.000
0.005
pass
—
Hokkaido 2018-09 blackout is visible
0.050
−1.000
fail
bounds the claim
Permutation rejection rate at nominal 5%
0.273
0.120
fail
inference dropped
Bounds fixed before the gate was first run. Monthly light measures how long infrastructure stays down, not whether it went down for a few days.
B6 · Which light measure sees the disaster?
2011 gap from the synthetic control (%)
Fukushima
Miyagi
Iwate
Mean brightness per km² (headline)
−16.1
−5.0
−11.1
Total light emitted
−16.7
−1.4
−15.9
Population-weighted mean (inequality variable)
−12.0
+4.4
−11.3
Population weighting plays down the rural coast and evacuation zone that went dark. Match the measure to the geography of the shock.