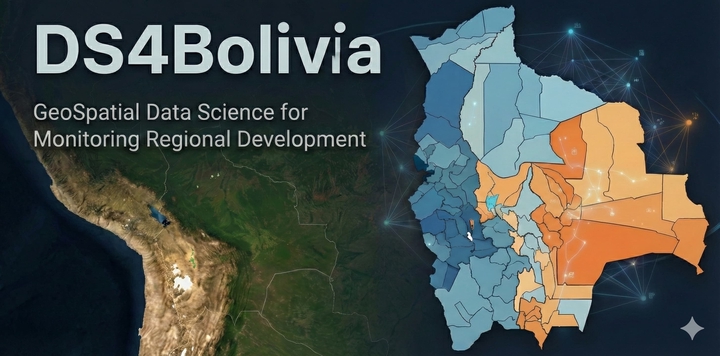
DS4Bolivia: A Data Science Repository to Study GeoSpatial Development in Bolivia
Welcome to DS4Bolivia! This project aggregates spatial and socio-economic datasets, interactive dashboards, and computational workflows focused on 339 municipalities of Bolivia. It is designed to bridge the gap between spatial analysis and sustainable development goals (SDGs).
This repository is organized for researchers and data scientists interested in:
- Spatial Econometrics: Understanding regional disparities, growth, and clustering.
- Spatial Machine Learning: Utilizing satellite imagery (Earth Observation) for predictive modeling.
- Sustainable Development: Tracking SDG indicators at a granular local level.
🖥️ Interactive Geospatial Dashboards
Explore the data without writing code. These applications visualize the space-time dynamics of key development indicators.
- Space-time dynamics of population, luminosity, land cover and GDP (2013-2019): Visualize the evolution of population density, night-time lights, land cover changes, and GDP estimates across Bolivian municipalities in 2013 and 2019.
🐍 Cloud-based Computational Notebooks
Step-by-step tutorials to help you reproduce our analysis. These notebooks utilize Python libraries such as GeoPandas and PySAL.
- Introduction to Exploratory Spatial Data Analysis (ESDA)
- Focus: Learn how to detect spatial clusters and outliers using Global and Local Moran’s I.
- Key Concepts: Spatial Autocorrelation, LISA Statistics, Choropleth Mapping.
💾 Spatially-Explicit Datasets
Curated datasets ready for analysis. These files are pre-processed to align with Bolivian municipal boundaries.
- SDGs & Satellite Embeddings (2017)
- Description: A merged dataset combining socio-economic indicators (SDGs) with high-dimensional feature vectors extracted from satellite imagery.
- Use Case: Training machine learning models to predict poverty or development indices based on visual patterns from space.
📜 Citation
If you use this repository in your research, please cite it using the following metadata.
APA Format
Mendez, C., Gonzales, E., Leoni, P., Andersen, L., Hendrix, P. (2024). DS4Bolivia: A Data Science Repository to Study GeoSpatial Development in Bolivia [Data set]. GitHub. https://github.com/quarcs-lab/ds4bolivia
BibTeX Format
@misc{ds4bolivia2026,
  author = {Mendez, Carlos and Gonzales, Erick and Leoni, Pedro and Andersen, Lykke and Hendrix, Peralta},
  title = {{DS4Bolivia}: A Data Science Repository to Study GeoSpatial Development in Bolivia},
  year = {2026},
  publisher = {GitHub},
  journal = {GitHub repository},
  howpublished = {\url{https://github.com/quarcs-lab/ds4bolivia}}
}
🚀 Construct your own dataset
The datasets are organized into modules, all linked by a unique identifier (asdf_id).
| Dataset Category | File Path | Description | Join Key |
|---|---|---|---|
| Region Names | /regionNames/regionNames.csv |
Administrative metadata (Municipality names, Department names). | asdf_id |
| Socio-Economic | /sdg/sdg.csv |
Sustainable Development Goal (SDG) indices and poverty metrics. | asdf_id |
| Satellite Features | /satelliteEmbeddings/satelliteEmbeddings2017.csv |
Feature vectors (embeddings) extracted from daytime satellite imagery. | asdf_id |
| Spatial Vector | /maps/bolivia339geoqueryOpt.geojson |
Geometric boundaries (Polygons) for all municipalities. | asdf_id |
⚠️ Important Note on Identifiers: > The primary key for joining all datasets in this repository is
asdf_id.
Whilemun_id(standard government code) is present in the administrative data,asdf_idensures consistency across the satellite embeddings and optimized map files provided here. Always ensure this column is treated as anintorstringconsistently across both dataframes before merging.
You can run the examples below immediately in Google Colab.
![]()
Example 1: Integrating Attribute Data
This script demonstrates how to merge the administrative names, socio-economic indicators, and satellite machine learning features into a single analytical dataframe.
import pandas as pd

# -----------------------------------------------------------------------------
# 1. SETUP: Define Source URLs
# We use the raw GitHub URL to stream data directly into Colab/Pandas.
# -----------------------------------------------------------------------------
REPO_URL = "https://raw.githubusercontent.com/quarcs-lab/ds4bolivia/master"

url_names = f"{REPO_URL}/regionNames/regionNames.csv"
url_sdg = f"{REPO_URL}/sdg/sdg.csv"
url_emb = f"{REPO_URL}/satelliteEmbeddings/satelliteEmbeddings2017.csv"

# -----------------------------------------------------------------------------
# 2. LOAD: Read CSVs
# -----------------------------------------------------------------------------
print("Loading datasets...")
df_names      = pd.read_csv(url_names)
df_sdg        = pd.read_csv(url_sdg)
df_embeddings = pd.read_csv(url_emb)

# -----------------------------------------------------------------------------
# 3. MERGE: Combine Dataframes
# -----------------------------------------------------------------------------
# Step A: Attach SDG data to Names
df_merged_step1 = pd.merge(df_names, df_sdg, on='asdf_id', how='inner')

# Step B: Attach Satellite Embeddings to the result
df_final = pd.merge(df_merged_step1, df_embeddings, on='asdf_id', how='inner')

# -----------------------------------------------------------------------------
# 4. VERIFY
# -----------------------------------------------------------------------------
print(f"Merge Complete.")
print(f"Original Municipalities: {len(df_names)}")
print(f"Final Merged Rows:       {len(df_final)}")
print(f"Total Columns:           {len(df_final.columns)}")

# Display the first few rows (names + first few embedding columns)
display(df_final[['mun', 'dep', 'index_sdg1', 'A00', 'A01', 'A02']].head())
Example 2: Integrating Spatial and Attribute Data
This script takes the merged data from Example 1 and attaches it to the municipality geometries (GeoJSON) for spatial analysis and plotting.
import geopandas as gpd
import matplotlib.pyplot as plt

# -----------------------------------------------------------------------------
# 1. LOAD SPATIAL DATA
# We load the optimized GeoJSON file containing municipality boundaries.
# -----------------------------------------------------------------------------
geojson_url = f"{REPO_URL}/maps/bolivia339geoqueryOpt.geojson"
print("Loading GeoJSON map...")
gdf_boundaries = gpd.read_file(geojson_url)

# -----------------------------------------------------------------------------
# 2. SPATIAL DATA PREPARATION
# GeoJSON often loads IDs as objects/strings, while CSVs load as integers.
# -----------------------------------------------------------------------------
# Force 'asdf_id' to integer to match the pandas dataframe
gdf_boundaries['asdf_id'] = gdf_boundaries['asdf_id'].astype(int)

# -----------------------------------------------------------------------------
# 3. ATTRIBUTE JOIN
# Merge the spatial dataframe (gdf) with the attribute dataframe (df_final).
# This creates a 'GeoDataFrame' capable of spatial operations.
# -----------------------------------------------------------------------------
gdf_bolivia = gdf_boundaries.merge(df_final, on='asdf_id', how='inner')

# -----------------------------------------------------------------------------
# 4. VISUALIZATION (Choropleth Map)
# Plot the "No Poverty" SDG Index (SDG 1)
# -----------------------------------------------------------------------------
fig, ax = plt.subplots(1, 1, figsize=(12, 10))

gdf_bolivia.plot(
    column='index_sdg1',    # Variable to map
    cmap='viridis',         # Color palette (perceptually uniform)
    linewidth=0.1,          # Border width
    edgecolor='white',      # Border color
    legend=True,
    legend_kwds={'label': "SDG 1 Index (No Poverty)", 'orientation': "horizontal"},
    ax=ax
)

ax.set_title("Bolivia: SDG 1 Index by Municipality", fontsize=15)
ax.set_axis_off()           # Turn off lat/lon axis numbers for cleaner look
plt.show()
Data sources
- SDG indicators are originally contructed by Andersen, L. E., Canelas, S., Gonzales, A., Peñaranda, L. (2020) Atlas municipal de los Objetivos de Desarrollo Sostenible en Bolivia 2020. La Paz: Universidad Privada Boliviana, SDSN Bolivia
🤝 Contributing
We welcome contributions! If you are fixing a Coordinate Reference System (CRS) issue, adding a new spatial model, or uploading fresh data, please submit a Pull Request.
Carlos Mendez
Associate Professor of Development Economics
My research interests focus on the integration of development economics, spatial data science, and econometrics to better understand and inform the process of sustainable development across regions.