Mapping the dimensions of poverty through big data, socioeconomic surveys and machine learning in Cambodia
Abstract
Cambodia has grown rapidly yet remains economically vulnerable, with persistent poverty and limited, outdated subnational data. This study combines big-data sources, machine learning, and the Cambodia Socio-Economic Survey to predict and map the Global Multidimensional Poverty Index across 10 indicators in education, health, and living standards at fine spatial scales. By integrating gridded deprivation probabilities with building footprints, we estimate household-level deprivations. A random-forest model attains high accuracy for clean water, sanitation, food consumption, housing materials, cooking fuel, and electricity access. Key predictors include nighttime lights, population density, and road networks. Challenges persist—especially the need for unbiased training data and limited capacity to capture within-province or within-district disparities. Nevertheless, the approach shows how big data and machine learning can complement traditional surveys to deliver more granular and timely measurements on multidimensional poverty.
🌏 Introduction
- Rapid economic growth, yet persistent poverty (17.8% below national line in 2019)
- Traditional poverty data: outdated, costly, and coarse
- Poverty: not only income but health, education, and living standards (MPI framework)
Notes: Cambodia has seen strong growth but poverty remains. The study applies a multidimensional approach aligned with the Global MPI to capture deprivations beyond income, focusing on education, health, and living standards.
📊 Research Objectives
- Use big earth data + CSES survey + machine learning
- Map 10 poverty indicators across 3 MPI dimensions
- Generate high-resolution poverty maps
- Support targeted, cost-effective policy interventions
Notes: The aim is to integrate spatial and survey data using AI/ML to produce detailed poverty maps. This helps policymakers allocate resources efficiently and identify local vulnerabilities.
📚 Literature & Motivation
- Household surveys = costly, infrequent, spatially coarse
- Nighttime lights & satellite imagery → proxies for poverty
- Machine Learning (RF, XGBoost, CNNs) improve predictions
- Gap: Few studies integrate survey + EO data for multidimensional poverty
Notes: Prior research shows satellites and ML can help predict poverty, but integration with socioeconomic surveys for multidimensional poverty is limited. This study fills that gap.
🗂️ Data Sources
- CSES survey (10k households) – health, education, housing, income
- Satellite & EO data – nightlights, land cover, population density
- Infrastructure data – roads, schools, hospitals, utilities
- Building footprints – 3.8M residential/commercial buildings
Notes: A wide set of data was used: CSES for household info, EO data for environment and infrastructure, and building footprints to scale down predictions to household level.
⚙️ Methodology
- Random Forest model for classification
- Predicts deprivation probability for each indicator
- Training & validation split (90/10)
- Outputs: household & regional deprivation maps
Notes: The Random Forest algorithm was selected due to robustness and ability to process mixed data types. Models produce probability maps that can be aggregated at township, district, or province level.
📑 MPI Indicators
Health (2): Food consumption, access to healthcare
Education (2): Attainment, school attendance
Living Standards (6): Cooking fuel, sanitation, water, electricity, housing, assets
Notes: Ten indicators were chosen following the Global MPI. Equal weights applied across three main dimensions. These indicators reflect SDG priorities like education, health, clean water, and energy.
📈 Results – Variable Importance
- Nighttime lights = key predictor across indicators
- Population density & road networks also significant
- Strongest predictions: cooking fuel, clean water, sanitation, electricity
- Weak predictions: school attendance, healthcare, assets
Notes: Nightlights and population density best explain deprivation. Infrastructure access is also crucial. Indicators with spatial correlation (e.g., utilities) performed better than those tied to household-specific conditions.
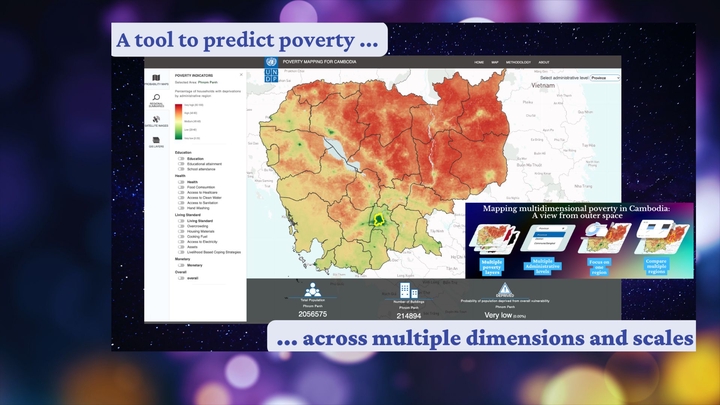
🗺️ Results – Spatial Poverty Patterns
- Urban centers: Phnom Penh, Siem Reap, Battambang → low deprivation
- Remote provinces: Preah Vihear, Ratanakiri, Mondulkiri → high deprivation
- Poverty lower near main roads & borders (trade effects)
Notes: Spatial maps show concentration of deprivation in remote, poorly connected regions. Urban and border areas with infrastructure show lower poverty.
💡 Discussion
- Spatial ML useful but limited for indicators with weak spatial signals
- Household survey data not designed for ML → location approximation issues
- Need for richer survey integration (e.g., accessibility questions)
- EO + ML offer granular, dynamic poverty mapping
Notes: While promising, ML struggles when data lack spatial correlation. Improved survey design can enhance integration. This hybrid approach shows potential for real-time, fine-grained poverty monitoring.
✅ Conclusion
- 10 MPI indicators mapped using EO + survey + ML
- Best results for infrastructure-related deprivations
- Enables household-level poverty estimates
- Supports SDGs: No Poverty, Quality Education, Health, Clean Water, Energy
- Future research: spatial autocorrelation, inequality decomposition, advanced AI
Notes: This work shows how AI and EO data complement traditional surveys to map multidimensional poverty. Future directions include advanced spatial analysis and deep learning models for better accuracy.
Carlos Mendez
Associate Professor of Development Economics
My research interests focus on the integration of development economics, spatial data science, and econometrics to better understand and inform the process of sustainable development across regions.