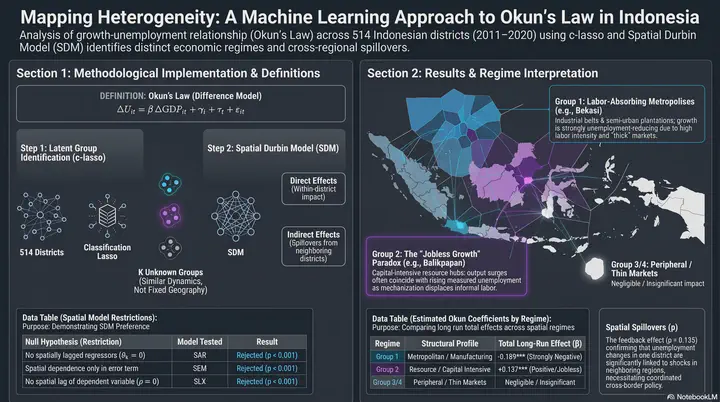
Okun's law and spatial regimes in Indonesia: A machine learning approach
Abstract
We study how output growth translates into unemployment changes across districts in Indonesia, over the 2011–2020 period. Instead of imposing predetermined geographic groups, we apply a data-driven approach to identify districts with similar growth—unemployment dynamics. We find that the growth—unemployment relationship (Okun’s law) varies markedly across districts: growth substantially reduces unemployment in some, while it is negligible or even reversed in others. To account for spatial dependence across districts, we estimate spatial models that decompose the total effect into each district’s own response and spillovers from neighboring districts. These spillovers are both statistically significant and economically sizeable, suggesting that growth shocks diffuse well beyond individual district borders. Overall, our findings underscore the limitations of aggregate Okun estimates and the need for policies that are locally tailored and coordinated across neighboring regions.
The puzzle
Okun’s law is one of macroeconomics’ most reliable regularities: when output grows, unemployment falls. Yet estimated for Indonesia as a single economy, the relationship does not hold. The reason is aggregation. A vast, heterogeneous archipelago is not one labor market, and a national average quietly cancels out regions that move in opposite directions. The question, then, is not whether Okun’s law holds in Indonesia, but where.
A two-step, data-driven approach
Rather than imposing geographic groups in advance (say, “West” versus “East”), the authors let the data sort districts into groups with similar growth–unemployment dynamics, then model how those dynamics spill across space. The framework is descriptive — it maps associations, not causal effects.
graph LR
    A("<b>Step 1 — C-Lasso</b><br/>(machine learning)<br/><i>Sorts districts into latent regimes<br/>sharing a growth-unemployment pattern</i>")
    B("<b>Step 2 — spatial Durbin model</b><br/><i>Splits each regime's response into a<br/>direct (local) and indirect (neighbor<br/>spillover) association</i>")

    A --> B
    classDef blue fill:#1f2b5e,stroke:#6a9bcc,stroke-width:3px,color:#e8ecf2
    classDef orange fill:#1f2b5e,stroke:#d97757,stroke-width:3px,color:#e8ecf2
    class A blue
    class B orange
Four latent regimes
The classifier uncovers four distinct regimes that cut across administrative and physical geography — districts in the same group need not be neighbors. Each tells a different story about how growth meets the labor market.
| Regime | Structural profile | Examples | Okun behavior |
|---|---|---|---|
| Group 1 | Labor-absorbing centers — metropolises, industrial belts, smallholder plantations | Bekasi, North Jakarta, Makassar, Medan | Strong, textbook. Growth co-moves with falling unemployment, locally and in neighbors. |
| Group 2 | Capital-intensive hubs — resource zones, mechanized corporate farming | Balikpapan, Central Jakarta, rural Java pockets | Reversed. Faster growth tracks higher measured open unemployment. |
| Group 3 | Transitional centers — secondary cities shifting from agriculture to services | Cilacap, Indramayu, Malang | Weak. Little baseline link; adjustment runs through hours worked, not layoffs. |
| Group 4 | Peripheral markets — thin, isolated rural island economies | Remote Papua, East Nusa Tenggara | Negligible. Pervasive informality severs the link to formal unemployment. |
Why does growth co-move with rising unemployment in Group 2? Where capital-intensive industry and corporate agriculture dominate, growth often arrives through mechanization that displaces traditional farm labor. As displaced workers leave informal or family work to look for formal wage jobs, they enter the statistics as “openly unemployed.” Measured unemployment rises alongside output through search frictions and skills mismatch — not because growth itself destroys jobs.
Robustness at the province level
To check that the pattern is not an artifact of district-level noise, the authors re-run the framework on 34 provinces. It reproduces a similar structure, now in three regimes:
- Diversified, demand-rich provinces — industrial and consumer hubs with a steep Okun coefficient of $-0.262$.
- Agricultural commodity heartlands — large corporate plantations where growth is locally “jobless” but generates spillovers to neighbors.
- Commodity-frontier enclaves — thin labor markets tied to mining and heavy industry, with a near-flat coefficient of $-0.033$.
Spatial spillovers matter
Labor-market adjustment does not stop at district borders. Changes in unemployment are correlated across neighboring districts ($\rho = 0.135$), so a growth shock in one place reaches the next.
Separating local responses from spillovers is what makes this visible. In Group 1, growth is associated with lower unemployment at home (direct association $-0.112$) and with lower unemployment next door (indirect spillover $-0.077$). A model that ignores spillovers would miss roughly the entire neighboring footprint of regional momentum.
Key takeaways
- Aggregate estimates mislead. A single national Okun coefficient averages over regimes whose growth–unemployment associations point in opposite directions.
- Diversified hubs are the engine. In metropolitan and smallholder-plantation districts (Group 1), output gains translate most reliably into job creation, at home and nearby.
- Structural change reshapes absorption. Moving from family farming to mechanized corporate agriculture lowers how many workers the local economy absorbs per unit of output.
- Informality hides slack. In peripheral regions (Group 4), open-unemployment figures understate distress because people fall back on underemployment and informal work.
Open questions
- If capital-intensive growth (Group 2) keeps pushing displaced farm workers into open unemployment, how can local governments build training pipelines that move them into modern service jobs?
- Given how much of the total association runs through spillovers in labor-absorbing zones, should planning shift from isolated district targets toward coordinated multi-district economic corridors?

Carlos Mendez
Associate Professor of Development Economics
My research interests focus on the integration of development economics, spatial data science, and econometrics to better understand and inform the process of sustainable development across regions.