expdpy
What patterns and relationships hide in your panel data? expdpy reveals them in Python, with Plotly figures, publication tables, and no-code Streamlit apps.
Open-source Python packages for regional, spatial and panel-data analysis.
What patterns and relationships hide in your panel data? expdpy reveals them in Python, with Plotly figures, publication tables, and no-code Streamlit apps.
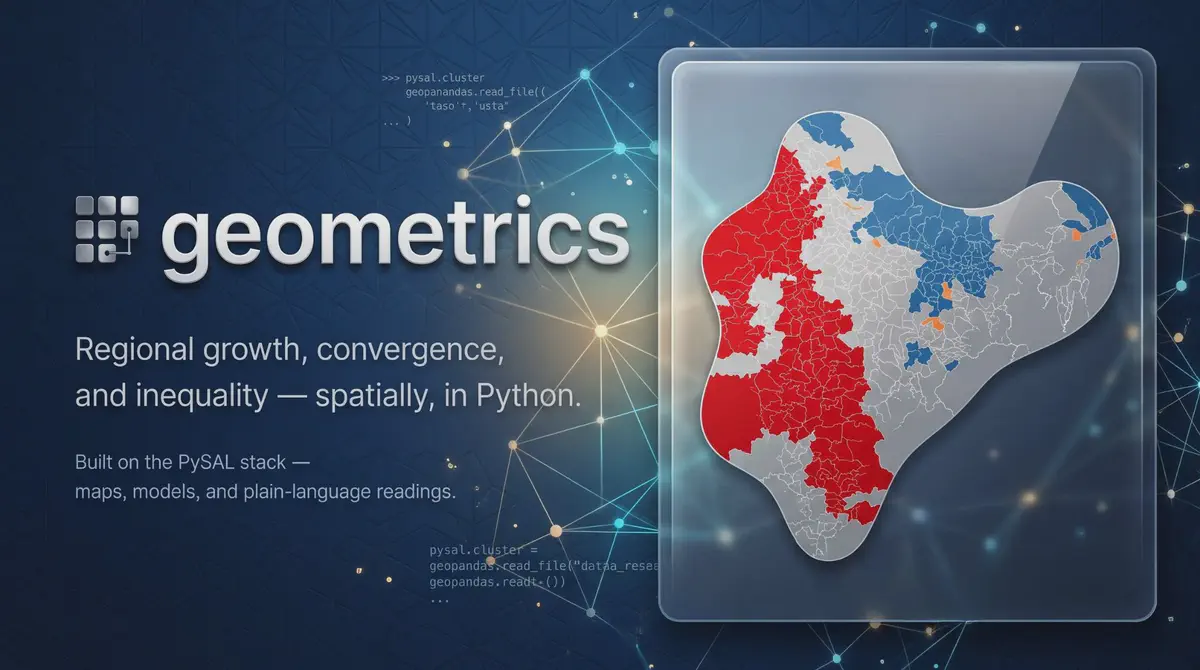
Are poorer regions catching up, and is inequality falling? geometrics answers with spatial methods in Python, Plotly figures, and no-code Streamlit apps.
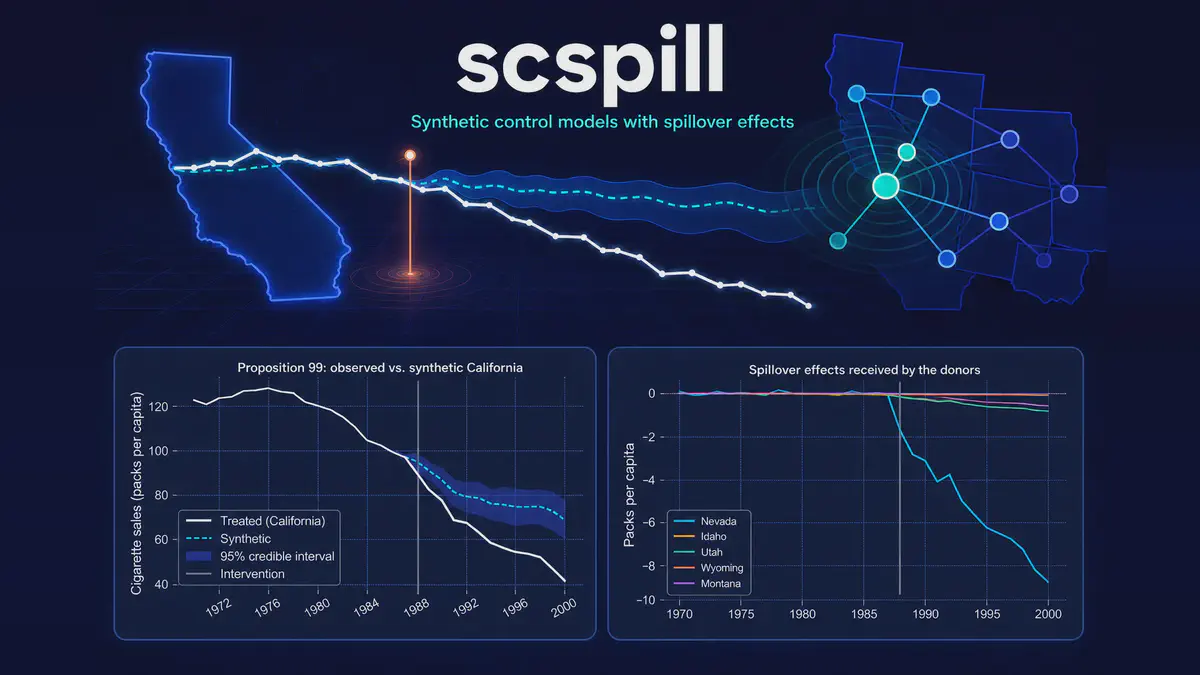
Did a policy really work if it also affected the comparison regions? scspill, a Python package, estimates both the true effect and the spillover to them.