Wealth and weight revisited
A Bayesian model averaging approach to the Obesity Kuznets Curve
84countries
2000–2020study period
1,195main BMA observations
Katerine Restrepo Gómez · He Du · Carlos Mendez
The European Journal of Health Economics · Published October 8, 2026
October 11, 2026
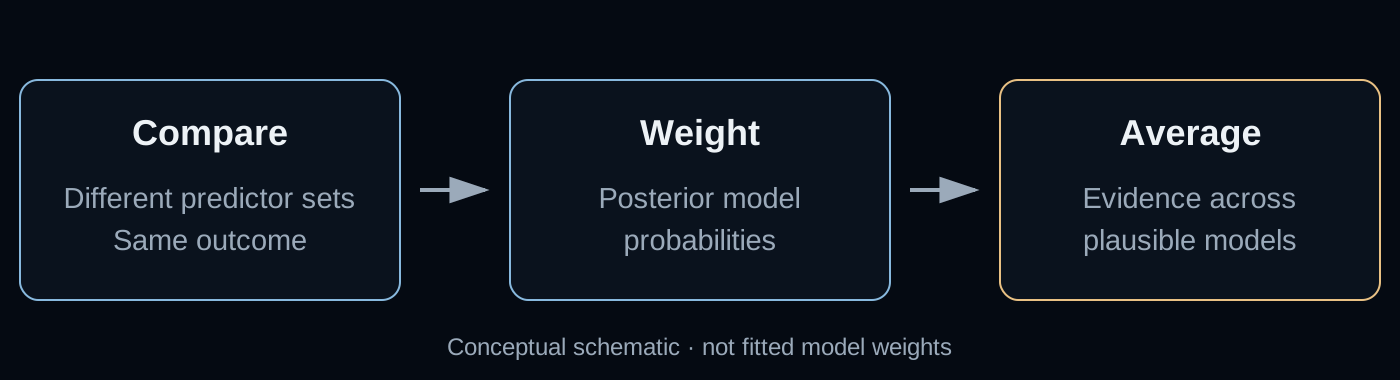
Let the evidence weigh competing models
The investigation · From model uncertainty to a curve
Fixed effects separate country differences from time changes
Country effects
Absorb persistent differences between countries.
Year effects
Absorb shocks shared in a given year.
Neither removes unobserved factors that change differently across countries.
Model averaging avoids betting on one control set
Country and year effects stay in every model.
Inclusion probability measures support across models
\[\operatorname{PIP}(X_k)=\sum_{M_j\,\text{containing}\,X_k}P(M_j\mid D)\]
PIP near 1: the predictor is retained across almost all posterior model weight.
High inclusion support is not proof of a causal effect.
Three income terms allow two changes in direction
\[f(x)=\beta_1x+\beta_2x^2+\beta_3x^3,\qquad x=\ln(\mathrm{GDPpc})\]
One linear term fixes the slope. A quadratic can bend once. A cubic can bend twice.
Read all three coefficients together.
Both priors retain the same income pattern
| Log GDP per person |
−189.358 |
−187.464 |
| Squared log GDP |
21.620 |
21.405 |
| Cubed log GDP |
−0.804 |
−0.796 |
The income relationship survives this change in prior specification.
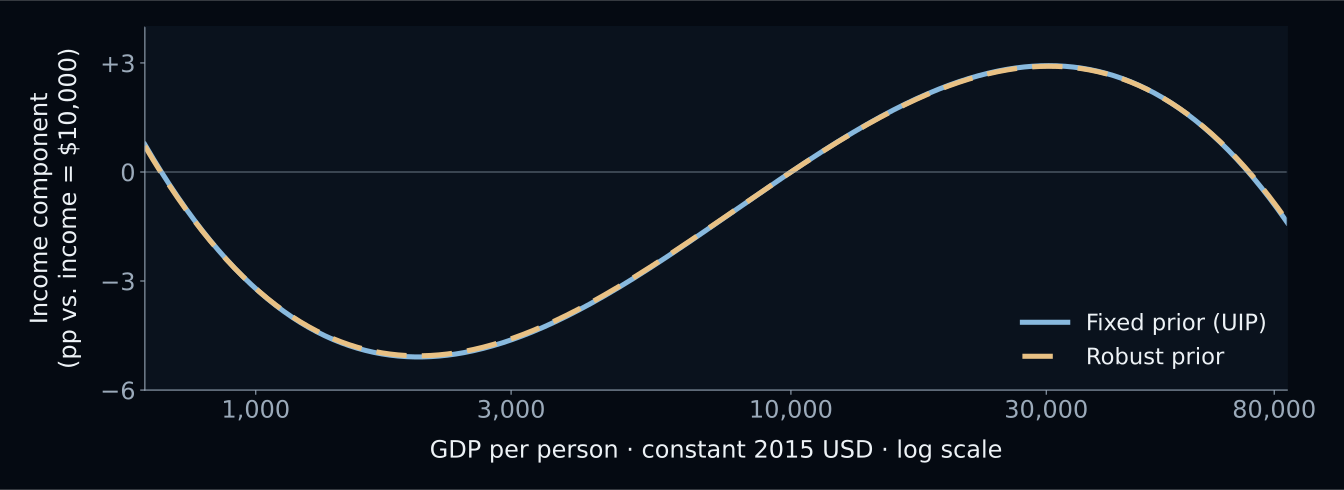
The estimated income component falls, rises, then falls
The two priors produce almost overlapping curves.
The cubic has two real turning points in each main model
\[D=\beta_2^2-3\beta_1\beta_3>0\]
| Two-way fixed effects + controls |
4.97 |
| BMA · fixed prior |
10.69 |
| BMA · robust prior |
10.51 |
Table 3 · This is a shape check on point estimates, not a confidence interval.
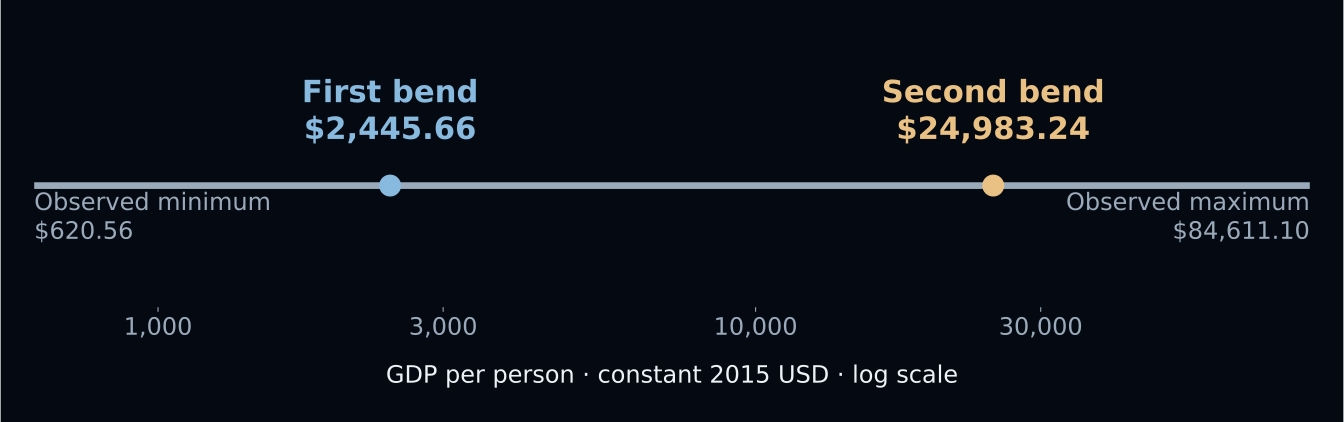
The controlled panel model turns within the income range
The two bends are not extrapolations beyond the sample’s income range.
Pooled pictures and panel estimates answer different questions
| Combines differences across countries |
Uses within-country time variation |
| No country fixed effects |
Country and year effects included |
| N-shaped all-economy fit |
Inverted-N income component |
The pooled all-economy graph is not the evidence for the main inverted-N claim.
Robust correlates extend beyond national income
| Forest area |
Negative |
1.00 |
| Renewable energy share |
Negative |
1.00 |
| Population density |
Negative |
1.00 |
| Arable land per person |
Positive |
1.00 |
Different units prevent ranking effect sizes from these signs.
Five-year lags preserve the signs on all three income terms
| Log GDP per person |
−233.992 |
−231.340 |
| Squared log GDP |
27.135 |
26.840 |
| Cubed log GDP |
−1.037 |
−1.026 |
This check changes the timing and sample; it does not establish causality.
Stable model results still leave important uncertainty
- Curve uncertainty: no joint posterior here for a valid band.
- Coverage: sparse, less reliable evidence at very low incomes.
- Aggregation: national patterns need not describe individuals.
Robustness within this framework is narrower than universal certainty.
Model averaging cannot remove every source of bias
Objection. Could omitted changes drive both income and obesity?
Response. Yes. Averaging addresses model selection, not causal identification.
Treat the curve as evidence about associations, not a growth prescription.
Look beyond a single income threshold
The resolution · Multiple stages, conditional associations
Economic growth alone does not guarantee lower obesity
The finding: a decline–rise–decline income component survives two priors.
The implication: examine the food, urban and environmental context at each stage.
The next step: test mechanisms with finer data and credible causal designs.
A model-based turning point is not a universal target for policy.
The published tables make every claim inspectable
Published paper · open access
Full paper PDF · tables and appendix
Website summary & infographic
Download the Quarto source
The full study dataset is available from the corresponding author on reasonable request.